| Capability | Teo’s Rank for MS BI | Comments |
| Infrastructure | BI Platform Administration
Capabilities that enable scaling the platform, optimizing performance and ensuring high availability and disaster recovery | High | On premises or cloud, I think the MS BI Platform is second to none |
Cloud BI
Platform-as-a-service and analytic-application-as-a-service capabilities for building, deploying and managing analytics and analytic applications in the cloud, based on data both in the cloud and on-premises | High | Power BI supports both pure cloud and hybrid architectures |
Security and User Administration
Capabilities that enable platform security, administering users, and auditing platform access and utilization | Medium | More work is required to support external users in Power BI, Power BI Embedded, and SSRS |
Data Source Connectivity
Capabilities that allow users to connect to the structured and unstructured data contained within various types of storage platforms, both on-premises and in the cloud. | High | As of this time, Power BI supports close to 70 connectors to let you connect to cloud and on-premises data sources. No scripting required. |
| Data Management | Governance and Metadata Management
Tools for enabling users to share the same systems-of-record semantic model and metadata. These should provide a robust and centralized way for administrators to search, capture, store, reuse and publish metadata objects, such as dimensions, hierarchies, measures, performance metrics/key performance indicators (KPIs) and report layout objects, parameters and so on. Administrators should have the ability to promote a business-user-defined data model to a system-of-record metadata object. | Medium | Power BI has done a good job to provide auditing and admin oversight but more work is required for proactive monitoring and improving its data governance capabilities |
Self-Contained Extraction, Transformation and Loading (ETL) and Data Storage
Platform capabilities for accessing, integrating, transforming and loading data into a self-contained storage layer, with the ability to index data and manage data loads and refresh scheduling. | Medium | SSIS is the most popular on-premises ETL tool. More work is required to bring similar capabilities in the cloud (I think Azure Data Factory is a step backwards) |
Self-Service Data Preparation
The drag-and-drop, user-driven data combination of different sources, and the creation of analytic models such as user-defined measures, sets, groups and hierarchies. Advanced capabilities include semantic autodiscovery, intelligent joins, intelligent profiling, hierarchy generation, data lineage and data blending on varied data sources, including multistructured data | High | Power BI Desktop and Excel has a fantastic query editor (originated from Power Query) that scores big with business users. Tableau doesn’t have such native capabilities. Power BI and Excel have best of class self-modeling capabilities (much better than Tableau). Azure Query Catalog can be used for dataset autodiscovery. |
| Analysis and Content Creation | Embedded Advanced Analytics
Enables users to easily access advanced analytics capabilities that are self-contained within the platform itself or available through the import and integration of externally developed models. | High | Not sure what is meant here by “advanced analytics capabilities”. Power BI supports integration with R, Azure Machine Learning, clustering, forecasting, binning, but I might be missing something. |
Analytic Dashboards
The ability to create highly interactive dashboards and content, with visual exploration and embedded advanced and geospatial analytics, to be consumed by others | High | “Highly interactive dashboards and content” is what Power BI is all about. |
Interactive Visual Exploration
Enables the exploration of data via the manipulation of chart images, with the color, brightness, size, shape and motion of visual objects representing aspects of the dataset being analyzed. This includes an array of visualization options that go beyond those of pie, bar and line charts, to include heat and tree maps, geographic maps, scatter plots and other special-purpose visuals. These tools enable users to analyze the data by interacting directly with a visual representation of it | High | According to Gartner’s definition, Power BI should score high but more work is required on the visualization side of things, such as ability to drill through a chart point as we can do in SSRS. |
Mobile Exploration and Authoring
Enables organizations to develop and deliver content to mobile devices in a publishing and/or interactive mode, and takes advantage of mobile devices’ native capabilities, such as touchscreen, camera, location awareness and natural-language query | High | Native apps for iOS, Android and Windows to surface both Power BI and SSRS reports. |
| Sharing of Findings | Embedding Analytic Content
Capabilities including a software developer’s kit with APIs and support for open standards for creating and modifying analytic content, visualizations and applications, embedding them into a business process, and/or an application or portal. These capabilities can reside outside the application (reusing the analytic infrastructure), but must be easily and seamlessly accessible from inside the application without forcing users to switch between systems. The capabilities for integrating BI and analytics with the application architecture will enable users to choose where in the business process the analytics should be embedded. | High | An Azure cloud service, Power BI Embedded allows you to do this with an appealing cost-effective licensing model. |
Publishing Analytic Content
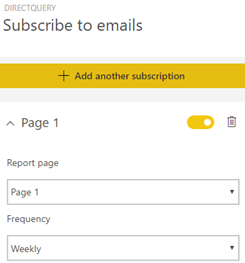
Capabilities that allow users to publish, deploy and operationalize analytic content through various output types and distribution methods, with support for content search, storytelling, scheduling and alerts. | Medium | Power BI supports subscriptions and data alerts but we can do better, such as to allow an admin to subscribe other users. “Storytelling” can mean different things but I thought the integration with Narrative Science can fall into this category. |
Collaboration and Social BI
Enables users to share and discuss information, analysis, analytic content and decisions via discussion threads, chat and annotations | High | Power BI supports this with workspaces and Office 365 unified groups. |