AzureML – Current State of Affairs

Organizations are showing increased interest in predictive analytics. A large retailer that is using Azure Machine Learning (or AzureML) has approached me to help them automate the process. I can’t help it but compare AzureML with the Analysis Service Data Mining each time I look at it. It looks like both Microsoft and I agree at this point, that what used to be difficult was made simple and vice versa. On the upside, AzureML provides business users with a cloud environment for creating predictive solutions without involvement from IT. AzureML has more features than SSAS Data Mining. Now that the focus is on the cloud, we probably won’t see future investments from Microsoft in SSAS Data Mining (and the Excel data mining add-in for that matter) which is currently limited to nine algorithms. By contrast, not only has AzureML many more algorithms but also it allows users to use R and Python, create workflows, and enjoys a vibrant community that is eager to contribute samples. So, AzureML to predictive analytics is what Power BI is to descriptive analytics. It’s all about democratizing analytics to anyone who needs it.
On the downside, operationalizing AzureML predictive experiments has left some room for improvement. True, it’s very easy to promote your experiment as a web service that can be called in a singleton (one row at the time) or batch manner. The Excel Azure Machine Learning Add-in makes it easy to call the service as singleton or batch if your data lives in Excel and user interaction is acceptable. The Chapter 10 source code of my Applied Power BI book demonstrates how a Power BI model can call a predictive service as singleton and the steps are explained in the book. However, automating this process is much more difficult. Previously, all it was required to periodically retrain an SSAS data mining model was to schedule a job with the SQL Server Agent. By contrast, simply scheduling an AzureML experiment for retraining is currently not an option. You need to integrate with the experiment’s web service either programmatically or by using Azure Data Factory. Similarly, scoring the model in a batch mode (instead of singleton execution), requires calling the batch web service endpoint. Consequently, this requires either custom code (see the Microsoft Azure Machine Learning Samples on CodePlex) or using an Azure Data Factory pipeline. Either of these scenarios would require an intervention from your fellow programmer or Azure Data Factory expert. By contrast, SSAS data mining models can be queried with DMX which is easy but promoting them to the outside world requires custom coding.
Here is a diagram of an Azure Data Factory pipeline that I implemented to demonstrate scoring an AzureML model in a batch execution mode using data from a stored procedure residing in an on-premises SQL Server. In this case, my AzureML predictive experiment returns the probability of a customer to purchase a product although what the experiment does is irrelevant as far automation is concerned.

The high-level steps to automate the process are:
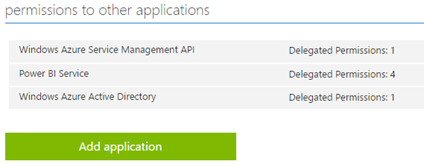
- Create a NewCustomers dataset (table) that represents the output of the stored procedure for the new customers that you’ll predict on. Because in this case we’re sourcing data from an on-premises server, we have to install (you guess it) a Data Management Gateway, which you can download from your Azure Data Factory service in the Azure portal. As of now, this gateway is not the same as the Power BI Gateway that is used also by PowerApps, Microsoft Flow and Azure Logic Apps, mind you.
- Because the predictive batch service requires an input, use the Copy Activity (blessed be the ADF team for adding it!) to save the results of the stored procedure to Azure Storage as an CSV file with headers.
- Use the AzureMLBatchExecution activity to pass the file to the batch endpoint of the predictive experiment.
- Save the predicted results from the predictive service as a file in Azure Storage and do whatever is needed with the results.
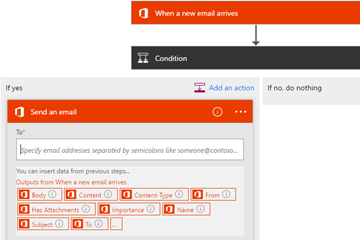
If the experiment gets the input data from Import Data (formerly known as a Reader), such as from on-premises or Azure SQL table, you can simplify scoring and retraining the model by creating a simple Azure Data Factory pipeline that has only the AzureMLBatchExecution activity. In this case, the activity passes no input to the web service and if the experiment writes to a database, no output is needed either. However, because the pipeline definition requires an output, I still had to create a dummy Azure Storage dataset (PredictedBuyersSQL) although not files will be sent to it.
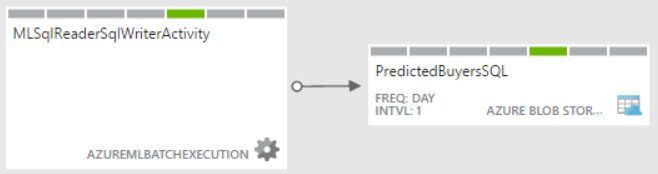
Here is what the simplified ADF pipeline may look when the experiment reads and writes to a database.
{
 "name": "PredictBuyersPipelineSQL",
 "properties": {
 "description": "Azure ML model with sql azure reader/writer",
 "activities": [
 {
 "type": "AzureMLBatchExecution",
 "typeProperties": {},
 "outputs": [
 {
 "name": "PredictedBuyersSQL"
 }
 ],
 "policy": {
 "timeout": "00:10:00",
 "concurrency": 1,
 "executionPriorityOrder": "NewestFirst",
 "retry": 1
 },
 "scheduler": {
 "frequency": "Day",
 "interval": 1
 },
 "name": "MLSqlReaderSqlWriterActivity",
 "description": "test",
 "linkedServiceName": "BikeBuyersWebServiceSQL"
 }
 ],
 "start": "2016-09-10T00:00:00Z",
 "end": "2016-09-14T00:00:00Z",
 "isPaused": true,
 "hubName": "adfprologikaonpremdf_hub",
 "pipelineMode": "Scheduled"
 }
}
AzureML will play an increasingly important role with predictive analytics on the rise. I hope the next release of AzureML would simplify operationalizing predictive experiments so that it doesn’t require programming effort or involvement from IT. Now that AzureML supports importing data from on-premises SQL Server and other cloud data sources, it should be simple to automate retraining and scoring models.

 Last week’s seminar on formulating a Power BI enterprise strategy held at the Microsoft office was a great success. Over 50 people witnessed the amazing capabilities of the Power BI platform. As Power BI evolves, we’ll have similar events to bring you up to date. If you couldn’t attend, you can find the slides