The title says it all! Note that the evaluation was done in July-August 2015. Some of the missing points Gartner points out in the report have been implemented already, such as custom visuals So by now the bubble should have moved up toward the ability to execute J
Beyond Power BI, I found the following Gartner’s strategic observations interesting:
By 2018, data discovery and data management evolution will drive most organizations to augment centralized analytic architectures with decentralized approaches.
By 2017, 75% of IT organizations will have a bimodal capability; half will not handle this well, by either remaining over-controlling or completely ignoring the risks of more agile approaches.
By 2017, highly featured and easy-to-use freemium and low-license-cost business intelligence (BI) offerings will accelerate user adoption deep into the enterprise beyond traditional BI users.
Want to learn Power BI? We’re still accepting students for the online class starting Monday.
https://prologika.com/wp-content/uploads/2016/01/logo.png00Prologika - Teo Lachevhttps://prologika.com/wp-content/uploads/2016/01/logo.pngPrologika - Teo Lachev2016-02-04 21:35:002021-02-16 02:32:33Gartner Positions Microsoft as a Leader in BI and Analytics Platforms
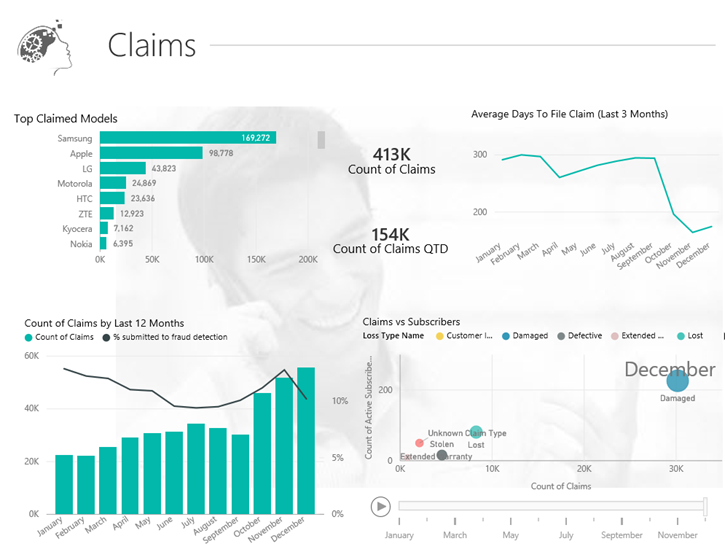
Microsoft launched a Power BI Partner Showcase section to help you “find the right solution for your organization” from certified partners like Prologika. I’m excited to announce the first Prologika Power BI Showcase! It’s based on the work we did for an insurance company. This solution transformed the organization’s data into a key strategic business asset, empowering employees like never before. It currently includes over 300 performance measures that can be analyzed across various dimensions, enabling business to collaborate and share insights with rich data storytelling. The solution delivers a “single version of truth” approach for reporting, and empowers business users to build customized reports and analyses using various tools.
“We are extremely excited for the actionable intelligence and foresight this new tool will bring to our organization” Director Supply Chain Analytics
Visit the solution page to learn more about how we did it, watch a short video, and even try the interactive reports! Have questions? Contact me to today to find how Power BI can change your business!
https://prologika.com/wp-content/uploads/2016/01/logo.png00Prologika - Teo Lachevhttps://prologika.com/wp-content/uploads/2016/01/logo.pngPrologika - Teo Lachev2016-02-04 03:38:002016-02-20 10:42:48Prologika Power BI Showcase
Call/email us if you have any questions about the class. Registration closes on January 31st.
Join Teo Lachev as he presents his online Applied Power BI class. Power BI is a Microsoft cloud-hosted BI platform that opens BI to everyone without reliance on IT. And most of it is free! This class is designed for business users and data analysts. You’ll learn:
What is Power BI and why it’ll disrupt the way you analyze your business.
How to get instant insights from cloud services, such as Google Analytics, Dynamics CRM Online, Salesforce, and many others.
How to create sophisticated self-service data models whose features are on a par with models built by BI pros.
How to clean and shape dirty data.
How to create insightful interactive reports and dashboards.
How to share BI content with other users and view it on mobile devices.
No travel, no hotel expenses, just 100% content delivered right to your desktop! Our intensive online classes teach you the skills to master Microsoft BI to its fullest. Use the opportunity to ask questions and learn best practices.
Applied Power BI Training in February
NEW!Applied Power BI Online Training Class Date: February 8 – February 9, 2016 Time: Noon – 4:00 pm EDT; 9 am – 1:00 pm PDT Delivery: Online presentation with access to recorded content
https://prologika.com/wp-content/uploads/2016/01/logo.png00Prologika - Teo Lachevhttps://prologika.com/wp-content/uploads/2016/01/logo.pngPrologika - Teo Lachev2016-01-27 03:20:002016-02-20 14:31:28Improve your Power BI skills – Five days left to register!
Join us for our first 2016 Atlanta MS BI and Power BI Group meeting on Monday, January 25th. Our sponsor, Panorama, will present Panorama Necto. And Patrick LeBlanc from Microsoft will present “Power BI for You” and show you how Power BI will disrupt the way you analyze data. Don’t forget to register at atlantabi.sqlpass.org.
Presentation:
Power BI for You
Level: Intermediate
Date:
Monday, January 25th, 2016
Time
6:30 – 8:30 PM ET
Place:
South Terraces Building (Auditorium Room)
115 Perimeter Center Place
Atlanta, GA 30346
Overview:
Most of us are overwhelmed with data from all the different applications that we use on a daily basis. Bringing all the data together is often a very time-consuming and sometimes a challenging process. Even further, attempting to analyze and visualize the data poses new challenges that is sometime difficult or impossible to overcome. Now with Power BI this can all be made very simple. Individuals, ranging from novice information workers to advanced IT professionals can quickly and easily transform, analyze and visualize data using a single solution, Power BI. In this session I will demonstrate how to Shape Data, Build a Data Model, Visualize Data and share the results of your work using the Power BI Service.
Speaker:
Patrick LeBlanc is a currently a Data Platform Solutions Architect with Microsoft. Along with his 15+ years’ experience in IT he holds a Master’s of Science degree from Louisiana State University. He is the author and co-author of five SQL Server books. Prior to joining Microsoft he was awarded Microsoft MVP award for his contributions to the community. Patrick is a regular speaker at many SQL Server Conferences and Community events..
Sponsor:
Panorama Necto is a worldwide leader in next generation self-service smart data discovery. It leverages a suggestive discovery engine that simplifies the business users’ data preparation while automating pattern exploration and analysis. Panorama Necto is powered by a unified and governed visualization and unique collaboration platform.
https://prologika.com/wp-content/uploads/2016/01/logo.png00Prologika - Teo Lachevhttps://prologika.com/wp-content/uploads/2016/01/logo.pngPrologika - Teo Lachev2016-01-21 22:55:132016-02-12 05:07:32Atlanta MS BI Group Meeting on January 25th
Scenario: You have installed Office 32-bit (I’m yet to see a company that installs 64-bit as IT loves default paths). Then, you install Power BI Desktop 64-bit. Upon trying to connect to some Office file, such as Access or Excel, you get a compatibility error. You try to install the 64-bit Microsoft Access Database Engine 2010 Redistributable but then you are greeted with “You have a 32-bit version of Office installed”.
Solution: Install the 64-bit Redistributable with the passive overwrite:
Download the 64-bit Microsoft Access Database Engine redistributable.
Open Command Prompt to the download location and execute the following command: AccessDatabaseEngine_X64.exe /passive
You can use a similar procedure to force the 32-bit driver if you have Office 64-bit.
Your 2016 resolution: bring your data to life! Don’t know where to start? I can help wherever you are! The first online run of Applied Power BI class is scheduled for early February. No travel, no hotel expenses, just 100% content delivered right to your desktop! Our intensive online classes teach you the skills to master Microsoft BI to its fullest. Use the opportunity to ask questions and learn best practices.
NEW!Applied Power BI Online Training Class Date: February 8 – February 9, 2016 Time: Noon – 4:00 pm EDT; 9 am – 1:00 pm PDT Delivery: Online presentation with access to recorded content
Power BI is a Microsoft cloud-hosted BI platform that opens BI to everyone without reliance on IT. And most of it is free! This class is designed for business users and data analysts. You’ll learn:
What is Power BI and why it’ll disrupt the way you analyze your business.
How to get instant insights from cloud services, such as Google Analytics, Dynamics CRM Online, Salesforce, and many others.
How to create sophisticated self-service data models whose features are on a par with models built by BI pros.
How to clean and shape dirty data.
How to create insightful interactive reports and dashboards.
How to share BI content with other users and view it on mobile devices.
.
https://prologika.com/wp-content/uploads/2016/01/logo.png00Prologika - Teo Lachevhttps://prologika.com/wp-content/uploads/2016/01/logo.pngPrologika - Teo Lachev2016-01-18 02:16:002021-02-16 04:59:58Online Applied Power BI Class Forming
Come and join me on Saturday, January 9 th at the first SQL Saturday BI edition in Atlanta. You’ll learn about the exiting new BI changes coming to SQL Server 2016 and the Microsoft on-premises roadmap!
https://prologika.com/wp-content/uploads/2016/01/logo.png00Prologika - Teo Lachevhttps://prologika.com/wp-content/uploads/2016/01/logo.pngPrologika - Teo Lachev2016-01-16 07:52:332016-02-20 14:32:23Presenting at SQL Saturday BI Atlanta
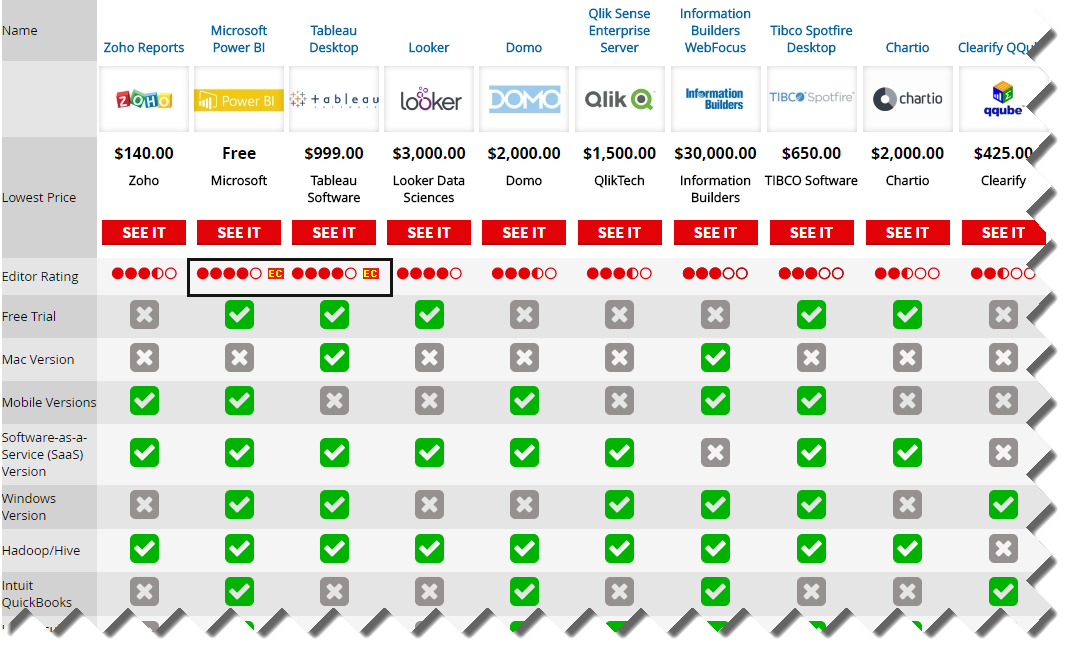
I came across this interesting PC Magazine article that just came up to compare 10 popular self-service BI tools. And the winner is? Power BI, of course, rubbing shoulders with Tableau for the Editor Choice award! The author, David Strom, did a great job reviewing the tools (this is not a trivial undertaking) but a few Power BI conclusions deserve clarifications:
Cons: “Cloud version has a subset of features found in Windows version” – The cloud version is meant to be simple on purpose so that business users can start analyzing data without any modeling.
Sharing: “Microsoft relies on the shared Microsoft OneDrive at Microsoft cloud service (or what it calls a “content pack”) to personalize and share your dashboard and reports via unique URLs” Power BI doesn’t rely on OneDrive for collaboration. Instead it supports three ways to share content: simple dashboard sharing, workspaces, and content packs.
Custom visuals: “You can get quickly up to speed by searching through an online visualizations gallery to find the particular presentation template you want to use to show your data. This is the reverse of what many BI tools such as Tableau Desktop ($999.00) at Tableau Software and Domo ($2,000.00) at Domo have you do, and it takes a bit of getting used to.” Not sure what this refers to. There are built-in visualizations and starting up with them is no different than using other tools. But we have also custom visuals that no other vendor has.
Custom visuals:” A new section called “Developer Tools” lets you build custom visualizations using a Visual Basic-like scripting language that is documented in a GitHub project. While it is still in beta, it could be a very powerful way to add your own custom look to your dashboards” The Dev Tools for implementing custom visuals outside Visual Studio is in preview but the actual visualization framework is not. And developers use TypeScript (superset of JavaScript) and not Visual Basic.
Speaking about reviews, here are some important Power BI characteristics that make it stand above the rest of the pack:
Data engine and DAX – no other tool can come close to the Power BI in-memory engine that allows data analysts to build data models that are on a par with professional models.
Hybrid architecture that allows to connect your visualizations to on premise data sources.
Self-service ETL with Power Query – as far as I know, no other tool has such capabilities.
Open architecture that allows developers to extend the Power BI capabilities
Great value proposition that follows the freemium model – Power BI Desktop is free, Power BI Mobile is free, Power BI service is mostly free.
https://prologika.com/wp-content/uploads/2016/01/logo.png00Prologika - Teo Lachevhttps://prologika.com/wp-content/uploads/2016/01/logo.pngPrologika - Teo Lachev2016-01-16 07:51:592016-05-08 14:06:56The Best Self-Service BI Tools of 2015
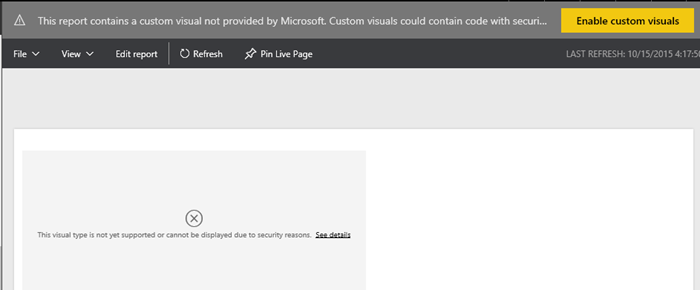
Scenario: You might have imported a custom visual in Power BI Desktop, tested it, and decided not to use it. However, even if your reports don’t use the visual anymore, Power BI will still prompt you if you want to enable custom visual with “This report contains a custom visual not provided by Microsoft…”. This is a security warning to avoid malicious code because custom visuals are deployed in Javascript.
Currently, there is no way in Power BI to disable this prompt. To make things worse, neither Power BI Service nor Power BI Desktop have a feature to get rid of the custom visual once it’s added to a Power BI Desktop file.
Solution: Here are the manual steps are followed to get rid of custom visuals in Power BI Desktop file for good:
Copy the Power BI Desktop (*.pbix) file. Rename the file to have a zip extension, e.g. from Adventure Works.pbix to Adventure Works.pbix.zip.
Unzip the file.
In the uncompressed folder where you unzip the file content, navigate to the Report folder, and open the Layout file in your favorite text editor.
At the top of the file content, find a resourcePackage string that includes the visual name (you could search for the name of the visual to locate it). For example, the resourcePackage element might look like this for the Sparkline visual: ,”resourcePackages”:[{“resourcePackage”:{“name”:”Sparkline1444636326814″,”items”:[{“path”:”icon.png”,”type”:3},{“path”:”Sparkline.js”,”type”:0}
Carefully, delete this entire string but make sure that you don’t end up with two commas or you miss a comma after the deletion.
While you’re in the uncompressed file content, delete also a folder that has the same name as the visual. Strictly speaking, this step is not needed to avoid the prompt but it’s a good idea to clean up all visual files so that you don’t distribute the visual Javascript source.
Zip the entire content again. For some obscure reason, besides getting rid of the visual, in my case compressing the file reduce the PBI Desktop file size almost twice! This reduces the time to upload the visual to Power BI Service.
Rename the file back to the original file name without the zip extension.
Now when you deploy the PBI Desktop file to Power BI and view its reports, you shouldn’t get prompted anymore.
Scenario: You’d want to have user-friendly field names in Tabular, Power Pivot, and Power BI Desktop, such as Claim Amount as opposed to database column names, such as ClaimAmount or Claim_Amount. Multidimensional has a feature that automatically delimits words with spaces when it detects a title case or underscore but Tabular lacks this feature. While you can rename fields in Tabular on field at the time, each step requires a commit action, thus taking long time to rename all fields.
Solution: While I’m not aware of a tool for renaming fields, the following approach should minimize the tedious work on your part:
Wrap your table with a SQL view. It’s a good practice anyway.
Alias the table columns. If you have a lot of columns, the easiest way to alias your columns is to use vertical copy and paste.
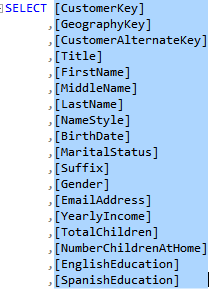
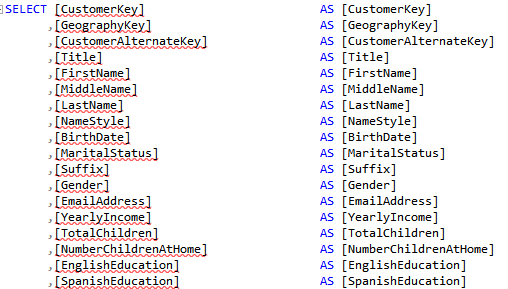
In SSMS, script the table as SELECT TO. This generates the SELECT statement in a suitable format for the next steps (column names enclosed in square brackets, comma on the left).
Hold the Alt key and select all columns by doing a vertical selection to enclose all column names, excluding the commas.
Press Ctrl-C to copy.
Hold the Alt key again. Click a place to the right of the first column and drag the mouse cursor down until you reach the last row where the last column is. You should see a vertical line going down.
Type ” AS ” without the quotes. The net effect is that SSMS enters AS for each column.
Press Ctrl-V to paste the column names. Here is the net result:
Now you can delimit the words with spaces. But if you have many columns, this can quickly get tedious too. Enter regular expressions.
Hold the Alt key again for vertical selection and select all alias columns, excluding “AS”.
Press Ctlr-H to bring up the SSMS Find & Replace. In the Find field, enter the regular expression ~(\[)[A-Z]. This expression searches for any capital letter after the left square bracket [.
In the Replace field, enter ” \0″ without the quotes. Notice that these is a space before the backslash. This replaces the capital letter match with an empty space and the capital letter.
Check the “Match Case” and “Use Regular Expressions”. Make sure that the “Look In” drop-down is set to Selection to avoid apply the replace to all the text.
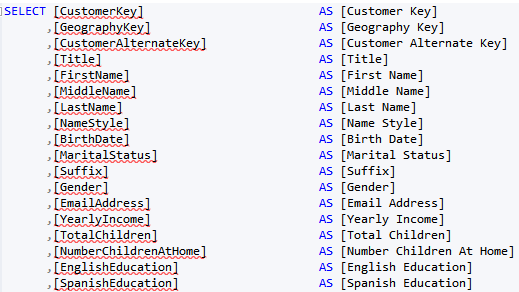
Click Replace All. Now you have all words delimited.
The regular expression I use is not perfect. It won’t discriminate capital letters; for example, it will delimit consecutive capital letters, such as ID as I D, but it’s faster to fix the exceptions than doing all replacements manually. And if you end up with a better expression, please send it my way. The last step, of course, is to import the view and not the table in Tabular, Power Pivot, or PBI Desktop.
https://prologika.com/wp-content/uploads/2016/01/logo.png00Prologika - Teo Lachevhttps://prologika.com/wp-content/uploads/2016/01/logo.pngPrologika - Teo Lachev2016-01-07 21:27:002016-02-12 05:29:34Implementing User Friendly Names in Tabular