Does Self-service BI Make Sense?
Besides data messiness (in direct proportion with the company size), another common data-related challenge that every organization nowadays is trying to tackle is how applicable self-service BI is to their business and to what extent it should be used. The tools are here and they are readily available. For example, given that Power Pivot is now natively integrated with Excel 2013, your power users will find a way to get inspired even if you don’t roll out a formal self-service BI strategy.
When self-service BI make sense
Having consulted with and trained many organizations ranging from small companies to Fortune 100 behemoths, I think that the following two scenarios appears as good reasons for self-service BI:
- Organizational BI is not an option. For example, a small company might not have resources to roll out an organizational BI solution, such as a management dashboard, and the data doesn’t require extensive transformation. Or, the IT department in a larger organization might be unable to keep up with business requirements, thus leaving business users on their own.
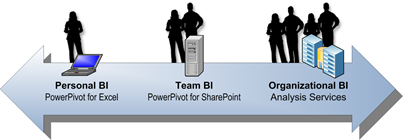
- Foster lateral (sometimes called divergent) thinking to generate and test ideas. Your business users might have “sketches” of alternative business scenarios or hypotheses that need to be tested quickly. For example, a business analysis in an oil services company wanted to know if the number of deployed rigs is correlated to the company’s revenue. In such cases, self-service BI can help that user to quickly mash up the revenue numbers stored in the data warehouse with the rig counts given to him as an Excel spreadsheet. Once the data that support such ideas is available and related to the organizational data, business analysts can test and converge such ideas to isolate the ones that are truly useful. Ideally, the next steps will be import the supporting data to the data warehouse so it’s available across the entire organization. Among the BI vendors, Microsoft is unique in providing the tools to implement this continuum, which might consists of self-service, team, and organizational BI steps.

When self-service BI doesn’t make sense
Let’s now mention scenarios when self-service BI might not be a good fit:
- Replacing organizational BI. By now, we all know that vendor claims stating that you don’t need organizational BI didn’t stand the test of time. Self-service BI alone is not going to solve your data integration and BI challenges. Most organizations will greatly benefit from a centralized data repository with clean and trusted data, which is typically referred to as a data mart or data warehouse, and a semantic model on top of it. Moreover, no matter how simple the tools are, self-service BI typically exceeds the skills of most information workers. Have you tried teaching a typical sales person how to create an Excel pivot report? Therefore, self-service BI should be viewed as completing, not competing, to organizational BI.
- Creating “spreadmarts” and Excel data dumps. If you’ve spent so much effort to centralize the data in a data warehouse, does it make sense to pull it out in different directions? If all the end users need is Excel data dumps, does it make sense to allow them to import millions of rows (probably requiring hardware and software upgrade) while a Power View on top of analytical model might be a better option? How secure that data will be on the user laptop? Finally, do you trust that the models your business users create can be used for deriving important decisions?
Still struggle with a self-service BI strategy or how to implement it? My Applied Power Pivot class and book should be able to help.