Power BI (Part 1 – Getting Started)
Microsoft BI has been criticized about its complexity and price because it requires SharePoint Server Enterprise for deploying Power Pivot models and dashboards. Microsoft introduced Office 365 (E3 or E4 plan required) and SharePoint Online (Plan 2 required) to mitigate such concerns and allow you to host Power Pivot and Power View in the cloud. Power BI is the next step in the Microsoft BI cloud strategy. As I explained in a previous blog and in the SQL Server Team blog, Power BI is essentially a cloud combo of all the self-service “power” tools (Power Pivot, Power View, Power Query, and Power Map) available on a subscription basis and running on Microsoft Azure, precluding SharePoint on-premises installation and licensing.
Microsoft has started inviting participants subscribed to the Power BI for Office 365 Preview to test the prerelease version of Power BI. During the Worldwide Partner Conference, Amir Netz, a Technical Fellow at Microsoft, demonstrated some of the Power BI most exciting features. With the exception of Power View HTML5 preview, none of these features (on-premise data refresh, natural query, and InfoNavigator) are in the Preview yet. However, Microsoft is planning to refresh the Preview on a monthly basis and push these features as they become available. Pricing hasn’t been announced yet. One disappointing news for me is that for now Microsoft doesn’t plan to support the “mixed” scenario by connecting Power View to an on-premises semantic model (Multidimensional or Tabular). In other words, in its first release Power BI will be limited to supporting Power Pivot models only, excluding organizational BI capabilities both on cloud and on premises.
The setup experience is simple and it should be familiar to you if you’ve provisioned Office 365 in the past. The invitation letter includes links to the following resources to get you started with Power BI.
| 1. | View the Power BI Provisioning Video and the provisioning guide |
| 2. | Visit the getting started page and check out the Power BI user guide and samples |
| 3. | Download the Power Query and Power Map add-ins for Excel |
| 4. | Download the Power BI mobile app for your Windows tablet |
| 5. | Monitor new feature announcements on the Power BI Blog |
| 6. | Give us feedback on the Power BI forum |
One provisioning step that you need to pay attention to is that you have to go to Users and Group section of the portal and assign yourself licenses to get access to the SharePoint sites.

Once you’ve done this and navigate to the Sites and then Team Site, you’ll see a link to the Power BI site. The Power BI site supersedes Power Gallery. It’s the hosting site for deploying Power Pivot models for up to 250 MB in size.
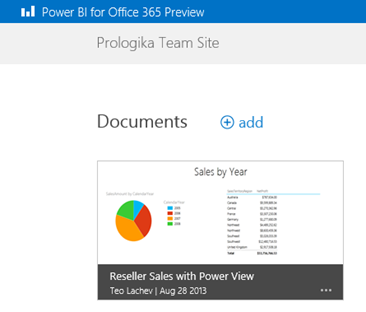
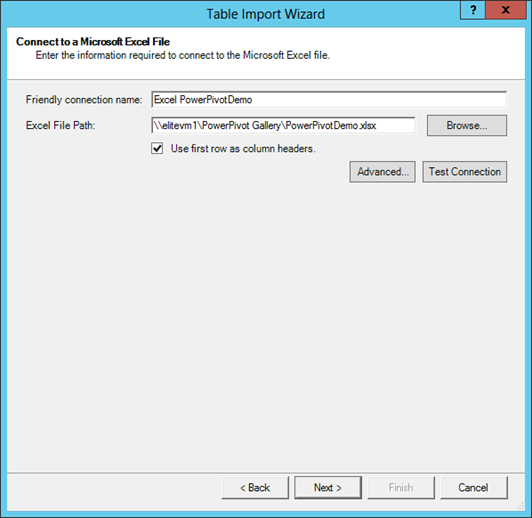
Once you click deploy an Excel file with your Power Pivot model and reports, you can click it to render the reports in the browser. If the file includes a Power View report, Power BI would render it by default in Silverlight but gives you an option to try the new HTML5 preview by clicking the Try the Preview button in the bottom right corner, as explained in this blog. I ran into several issues during testing, including:
- The Power BI site doesn’t always render
- The Power View Field List doesn’t always show
- The HTML5 preview generates empty rows. A list of the HTML5 supported features can be found here.
I believe that many organizations and ISVs will find Power BI attractive for cloud deployments of self-service and team BI solutions. Power BI mitigates concerns about on-premises SharePoint licensing, complexity, hardware and software overhead.