Yet Another Relative Dates Implementation

Yet another relative dates implementation in an Analysis Services cube. So far, I’ve implemented two. But I’m now starting a project to implement an accounting (G/L) cube and the traditional relative date approach where each relative date is calculated for the current member in the Date dimension doesn’t fly anymore. Heck, the business analyst even found the excellent “Translating Cognos PowerPlay Transformer Relative Date Functionality into SQL Server Analysis Services (SSAS)” whitepaper by David Greenberg and told me that’s exactly what they need. That’s what happens when you have smart users. Power Pivot anyone? While the business users are not empowered yet, let me share how I implemented this approach.

What’s Needed?

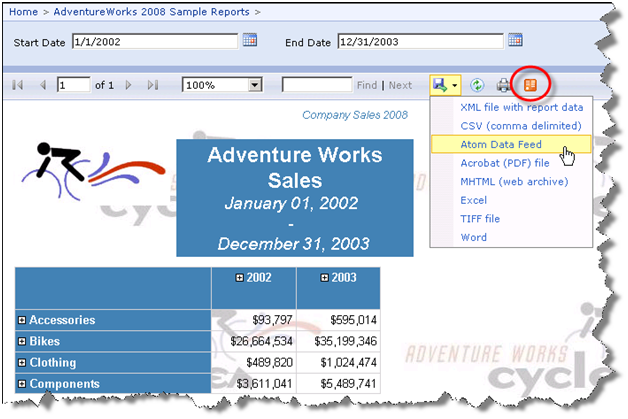
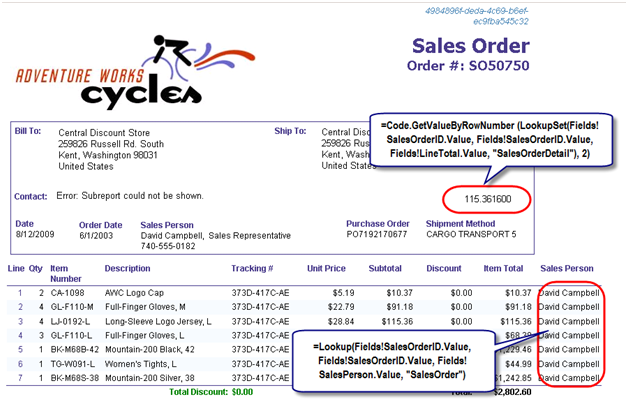
The difference now is that we want to drill down from each relative date to the periods that the relative date spans. Let’s take a look at the screenshot below.

082009_0151_YetAnotherR1

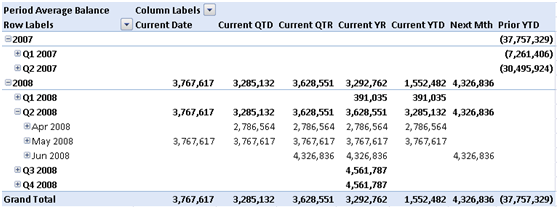
The cube sets the default member of the Date hierarchy to the accounting closing period, which is May 2008 in this case. The Current Date relative date shows the actual measure values for May 2008 only. The Current QTD shows the actual measure values for April and May 2008. The current QTR shows the actual measure values for April, May, and June, etc. In other words, when the user slices by Relative Dates and Date dimension, the system shows the actual measure values for the periods that belong to that relative date. Consequently, the only way for the user to get the calculated relative dates values, such as the Current YTD aggregate is to force the Date dimension to the [All] member but that’s fine with the business users.

Why We Disagree?

My implementation differs from the above-mentioned whitepaper in the following ways:

  1. I use a regular Relative Dates dimension instead of dimension calculated members that the SSAS BI Wizard and the whitepaper use. It looks to me that OLAP clients compete with each other to butcher dimension calculated members the most. Excel, for example, doesn’t retrieve calculated members by default and it doesn’t let you select individual calculated members. Other tools ignore them whatsoever. To avoid such pitfalls, I defined the Relative Dates dimension as a regular dimension.
  2. The whitepaper defines extra columns in the DimDate table that flag the qualifying dates. My implementation doesn’t do this because it’s not needed.
  3. The whitepaper produces the relative dates results by aggregating the measure across the qualifying date members. My approach uses simple scope assignments as you will see in a moment.

How This Got Implemented?

The implementation of this Relative Dates approach is remarkably simple.

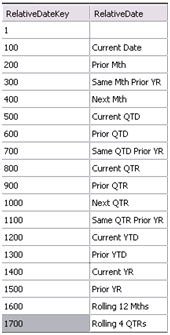
  1. Implement a SQL View on which the Relative Dates dimension will be based that hardcodes the Relative Dates members with SELECT…UNION statements. Note that first row on which will join the Date dimension doesn’t have a name because we will hide it in the next step.

082009_0151_YetAnotherR2

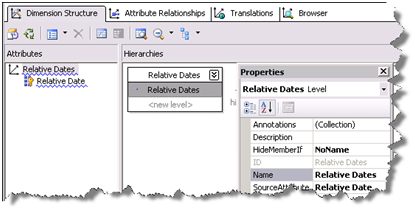
  1. Set up a Relative Dates dimension. Here I use a little trick to hide the first member because the user shouldn’t see it. Specifically, I set the AttributeHierarchyVisible of the Relative Date dimension key to False. Then, I created a Relative Dates hierarchy and set the HideMemberIf property of the Relative Dates level to NoName.

    082009_0151_YetAnotherR3

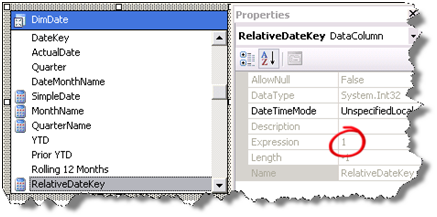
  2. I added a named calculation called RelativeDateKey to the DimDate table in the data source view with the expression value of 1 so I can relate the Relative Dates and Date dimensions.

082009_0151_YetAnotherR4

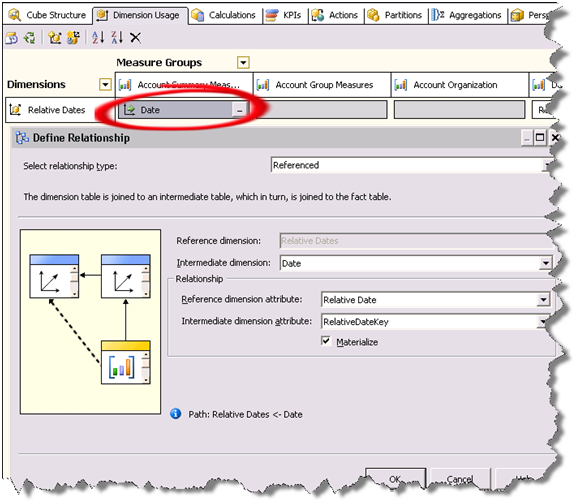
  1. Next, we relate the Relative Dates dimension to all associated measure groups with a referenced relationship via the Date dimension.

082009_0151_YetAnotherR5

  1. Time for some MDX programming. We use script assignments to populate the Relative Dates cells. By default, all cells intersecting with all Relative Dates members (except for the RelativeDateKey member) are empty. So, we just need to “carry over” the measure values from the qualifying members of the Date dimension. Here is what the first three assignments look like:

— Current Date

Scope ([Relative Dates].[Current Date], [Date].[Date].DefaultMember);

this = [Relative Dates].&[1];

End Scope;

 — Current QTD

Scope ([Relative Dates].[Current QTD], Exists(PeriodsToDate([Date].[Date Hierarchy].[Quarter], [Date].[Date Hierarchy].DefaultMember), [Date].[Date].[Date].Members));

this = [Relative Dates].&[1];

End Scope;

 — Current QTR

Scope ([Relative Dates].[Current QTR], Exists(Descendants(Ancestor([Date].[Date Hierarchy].CurrentMember, [Date].[Date Hierarchy].[Quarter]), [Date].[Date Hierarchy].[Date]), [Date].[Date].[Date].Members));

this = [Relative Dates].&[1];

End Scope;

Prior to these assignments, the cube script sets the default member of the Date hierarchy to the accounting closing period. Each assignment scopes on the qualifying members of the Date dimension and sets the scope to [Relative Dates].&[1] , which as we’ve seen is the first member of the Relative Dates dimension.

Why Does This Work?

The script carries over the measure values to the Relative Date members that intersect with the members of the Date attribute hierarchy. From there on, the measure aggregation function kicks in to roll up the values, e.g. by month, year, and quarter.

Reporting Services 2008 Online Training Class with Teo Lachev

There is still time to sign up for our Applied Reporting Services 2008 class with Teo Lachev. This three-day intensive event teaches you the knowledge and skills you need to master Reporting Services to its fullest. No travel, no hotel expenses, just 100% in-depth SSRS training delivered right to your desktop!

072809_2347_AppliedRepo1Applied Reporting Services 2008 Online Training Class
with Teo Lachev
Date: August 31 – September 2, 2009
Time: Noon – 4 pm EDT; 9 am – 1 pm PDT
12 training hours total for only $799!
072809_2347_AppliedRepo2

Attend this class for only $799 and get a free paper copy of the book Applied Microsoft SQL Server 2008 Reporting Services by Teo Lachev!

For more information or to register click here!

SQL Server 2008 R2 August Community Technology Preview Available

Microsoft released SQL Server 2008 R2 August Community Technology Preview which includes the Report Builder 3.0 R2 August CTP redistributable.

Reports as Data Feeds

Reporting Services SQL Server 2008 R2 features reports as Atom data feeds. This is accomplished with a new Atom Data Feed extension, as shown on this screenshot.

081409_0200_ReportsasDa1

This extension produces an atom service document (an *.atomsvc file). It lists at least one data feed for each data region in a report. In fact, some regions, such as tablix with column groups (cross-tab report layout) may generate multiple feeds.

At this point, you probably imagine subscribing to reports and receiving feeds in Outlook when report data is changed. Unfortunately, you won’t get very far doing so. As it turns out, atom data feeds are different from Atom feeds that most applications, such as IE and Outlooks understand directly. So even if you extract the Url out of the service document and display the .atom rendering of a report in IE, the browser won’t show useful information because it doesn’t understand that the data rows in the data feed are the important part.

So, how are report data feeds useful then? At this point, the design goal for reports as data feeds was to support Gemini – the new Excel 2010 extension that lets end users build in-memory cubes. Gemini can acquire data from variety of data sources, including data feeds and SSRS reports. Here is what it takes to subscribe to a report feed.

081409_0200_ReportsasDa2

  1. In the Gemini add-in, click the From Data Feed button.
  2. On the Connect to Data Feed step of the Table Import Wizard, browse to the data feed file you exported from the report. In this case, I am pointing to the atomsvc file exported from Company Sales 2008 report. On this step, you can set up advanced options, such as timeout, authentication, etc, and test the feed.

    081409_0200_ReportsasDa3

  3. On the Select Tables and Views step, select the regions on the report whose feeds you want to subscribe to. Since Company Sales 2008 has only one region, only one data feed is exposed. You can click the Preview button to preview the feed data. In the preview window, you can select which columns to import and set up a row filter (doesn’t seem to be working in the August CTP).

    081409_0200_ReportsasDa4Reporting Services, Analysis Services, Microsoft Office, SQL Server 2008 R2

  4. On the Import Summary step, preview the feed options and click Finish to import the data.

This imports the feed data into the Excel spreadsheet. From there, you can use Gemini to build the in-memory model and analyze the report data.

Reporting Services Lookup Functions

One new SSRS SQL Server 2008 R2 feature that caught my attention is lookup functions. When reading the Reporting Services discussion list, I come frequently across questions that ask if it is possible to look up a value from a dataset other than the dataset the region is bound to. Excluding getting the first or last value (First and Last functions) or aggregate functions that work on the entire dataset, the only solution was to cache the dataset in a report code-behind code and use custom code to perform the navigation.

R2 will change this by introducing Lookup, LookupSet, and Multilookup functions. The lookup functions are best understood with an example. Take a look at this report (attached) which is based on the Sales Order Detail 2008 report that ships with the Adventure Works sample reports.

081309_0142_ReportingSe1

I added a couple of textboxes to the report. The order details section includes a Sales Person field that displays the sales person’s name. What’s interesting is that the sales person name is retrieved from the SalesOrder dataset that feeds the order header section. Just to address the question that I can almost hear you asking, no, R2 will not support joining datasets at a report level. Instead, I use the Lookup function which performs on-the-fly search, as follows:

=Lookup(Fields!SalesOrderID.Value, Fields!SalesOrderID.Value, Fields!SalesPerson.Value, “SalesOrder”)

I pass the field of the SalesOrderDetail dataset (Fields!SalesOrderID.Value) on which the lookup will be based. I pass the field of the SalesOrder dataset that will be matched. As a third argument, I pass the field (Fields!SalesPerson.Value) of the SalesOrder dataset that I need. Finally, I pass the name of the dataset (“SalesOrder”) that will be searched. The Lookup function is executed for each row in the source dataset.

In the order header section, I display the third item total from the SalesOrderDetails dataset by using the LookupSet function, as follows:

=Code.GetValueByRowNumber(LookupSet(Fields!SalesOrderID.Value, Fields!SalesOrderID.Value, Fields!LineTotal.Value, “SalesOrderDetail”), 2)

You call LookupSet in the same way you call Lookup. The difference is that Lookupset returns a variant array of all values that match. I decided to make the demo more interesting and let you specify the row index needed by adding a simple function to the report code.

Function GetValueByRowNumber(ByVal items As Object(), ByVal pos as Integer) As Object

If items Is Nothing Then

Return Nothing

End if


If pos > items.Length -1 Or pos<0

Return Nothing

End If


Return items(pos)

End Function


The expression passes the variant array returned by LookupSet and the row index to the GetValueByRowNumber. The GetValueByRowNumber returns the field at that row.

The Multilookup function, which I don’t demonstrate, accepts an array of source values to match and returns an array of the matched values that have 1:1 relationship to the source values, such as:

=MultiLookup(Split(Fields!CategoryList.Value,”,”) , Fields!CategoryID.Value, Fields!CategoryName.Value,”Category”))

[View:/CS/cfs-file.ashx/__key/CommunityServer.Blogs.Components.WeblogFiles/blog/7532.Sales Order Detail 2008.rdl]

The Dazzling R2 Report Manager

In this and future blogs I’ll cover the most important new features in the forthcoming release of Reporting Services which will be included in SQL Server 2008 R2 (code-named Kilimanjaro or KJ for short). Let’s start with the most obvious new feature: the all new Report Manager UI.

SharePoint-like UI

The moment you open Report Manager, you will notice that significant work was done to make the UI more intuitive, a la SharePoint.

081209_0051_TheDazzling1

For example, similar to SharePoint, a drop-down context menu pops up when you hover on a report item that lets you quickly access relevant tasks.

Simplified UI

The management pages also received facelift. Microsoft has reduced the number of buttons and changed the tab styling so you are sure which tab is selected.

081209_0051_TheDazzling2

Although seemingly minor, I am sure you’d love the new look and feel. For example, I like the fact that I don’t have run a report or switch to Details mode just to get to the report properties.

Report Builder 3.0 ClickOnce

Another welcome enhancement is that opening a report in Report Builder, launches Report Builder 3.0 (more on it in another post) by default. Report Builder 1.0 is still installed but it’s not the default reporting client. You see the writing on the wall. Report Builder 1.0 days are counted and you better embrace the future.

AJAX Report Viewer

Another major enhancement is the debut of an AJAX-enabled ReportViewer control (developers will get the Visual Studio counterpart in Beta 2 of Visual Studio 2010). The control eliminates visible page reposts when interactive actions, such as drilldown, are initiated. The page fades out but it stays in place and a spinny lets the user know that an interactive action is taking place.

081209_0051_TheDazzling3

All in all, end users and administrators will enjoy the new Report Manager. You won’t have to switch to SharePoint integration mode just to get a SharePoint-like UI.

New Reporting Services Features in SQL Server 2008 R2 CTP2

It turned out that for time being the CTP2 of SQL Server 2008 R2 which I announced yesterday is available for TAP participants only. It will be publicly available on Wednesday. Meanwhile, Robert Bruckner listed the new Reporting Services features which got implemented in CTP2. The biggy is the new map region that lets you visualize geospatial and geometry data.

In my first book I had a sample that demonstrated how to export a report as a data feed. Well, in R2 this will be natively supported. Reports as data feeds, anyone? Visual Studio 2010 Beta 2 will include an AJAX Report Viewer. I would hope for a Silverlight version but one step at a time.

Again, post your KJ-related question to the Reporting Services forum.

SQL Server 2008 R2 CTP Available

Microsoft just pushed CTP2 of SQL Server 2008 R2 build #1092.20 (code-named Kilimanjaro).

SQL Server R2 Forums Available

The SQL Server R2 (Kilimanjaro) discussion forums went live today. Your humble correspondent is the moderator of the Reporting Services forum. SQL Server R2 CTP 2 should be out on connect.microsoft.com shortly. Looking forward to your feedback!

SharePoint Integrated with Reporting Services on Windows Vista

So, how’s this not cool? Running SharePoint integrated with Reporting Services on Windows Vista! I’ve always had a grudge with SharePoint that it doesn’t run on a desktop OS. This forces you to install Windows Server or use a virtual image, both options far from ideal. When I went to TechEd I blurted by disappointment to a couple of SharePoint gurus who clued me in (this is why we go to conferences, right, to learn the latest hacks) but I didn’t have time to try it … until today.

The solution is to use the Bamboo’s workaround (OK, an ingenious hack) but it works like a charm. What about Windows 7 which has recently RTM’ed? Bamboo took care of that as well. I hope Microsoft will take a note and finally support officially SharePoint on a desktop OS. If SQL Server can scale down all the way to mobile devices, so should SharePoint.

Bamboo made my day today!

080709_2315_SharePointI1