SQL Server 2008 February CTP Is Out

February CTP is out. It brings the much anticipated integration with Visual Studio 2008 and the new BIDS Report Designer.

Download the February CTP here:
http://www.microsoft.com/sql/2008/prodinfo/download.mspx

Updated Books Online for February CTP are available here:
http://www.microsoft.com/downloads/details.aspx?familyid=19DB0B42-A5B2-456F-9C5C-F295CDD58D7A&displaylang=en


What’s new in Reporting Services February CTP (compared to the previous November 2007 CTP):

  • Support for Microsoft Word Rendering
    This allows users to render reports as Word documents that are compatible with Microsoft Word 2000 and greater.
  • Data Visualization Enhancements
    Data Visualization Enhancements provides significantly improved support for Chart and adds support for Gauge controls directly within reports.
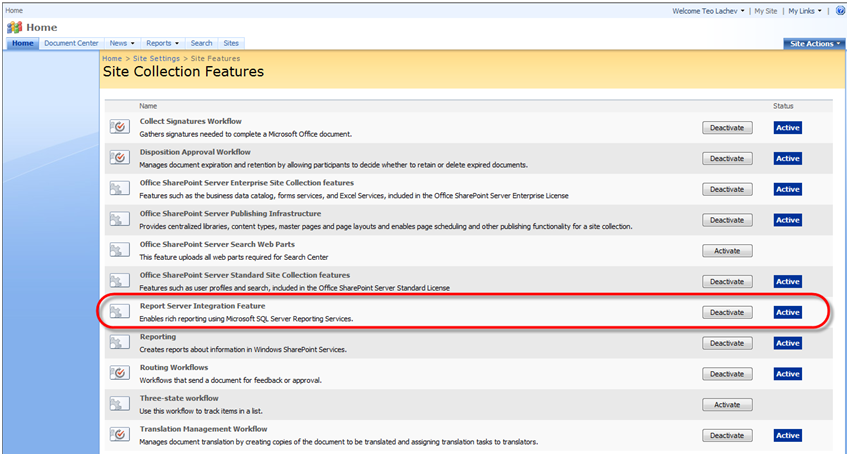
  • SQL Server 2008 Reporting Services Add-in for Microsoft SharePoint Technologies
    The SQL Server 2008 Reporting Services Add-in for SharePoint Technologies allows you to take advantage of SQL Server 2008 report rendering, processing and management capabilities in SharePoint Integrated mode.  This version includes Data-driven subscriptions.
  • Report Design Enhancements in Business Intelligence Development Studio (BIDS)
    BIDS overall has been migrated from a Visual Studio 2005 to Visual Studio 2008 platform.  In addition, the report design tools found in BIDS were significantly updated for Reporting Services.  Updates include:
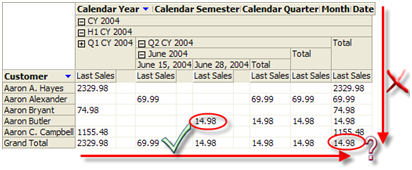
    – the more powerful Tablix based Tables, Lists, Matrices
    – the Report Data window for easier interaction with data fields
    – the integration of data visualization enhancements (Chart, Gauge)
    – new dialogs throughout the design experience
  • Throughput Enhancements
    Further improvements in report rendering throughput, the number of reports rendered in a given amount of time for several types of workloads.

Last Non Empty Affairs

Enterprise Edition of Analysis Services 2005 and 2008 supports semi-additive functions, such as LastNonEmpty, LastChild, and so on, to facilitate working with semi-additive measures, such as account balances and inventory snapshots. For example, the screenshot below shows LastNonEmtpy in action. To demonstrate this, I added a Last Sales measure to the Internet Sales measure group in the Adventure Works cube and set its AggregationFunction property to LastNonEmpty. Of course, this doesn’t make much sense because sales amounts are fully additive but it’s OK for demo purposes.

020608_2350_LastNonEmpt1

As expected, the quarter and year totals show the last non empty sales. The customer totals are correct too because semi-additive measures sum across any dimension except Time. But what about the grand total of $14.98? Shouldn’t we get the sum of the quarter (or year) subtotals?

To answer this question, we need to understand how LastNonEmpty operates. LastNonEmtpy works across time and not across other dimensions. Because the last customer recorded sales are in June 2008, LastNonEmpty gives you Q2 total of $14.98 which becomes the YTD total as well. So, does it make sense to sum the totals vertically? The philosophical answer is “it depends”. If this was inventory balances, the question is why we have missing balances in the last day. In other words, to get the vertical sum right we need to record balances for each product for each period. One may say that in this case LastNonEmpty is correct because it makes no assumptions about what happened to the “missing” values for products, customers, etc. It could be that we didn’t record them or it could be that there we discontinued that their ending balance is indeed not applicable.

But, there could be cases when we need LastNonEmpty to sum vertically instead of getting the last values. For example, the cube may have test scores and you may need to get the last score, such as to calculate the average student or school score. To address this requirement, our first impulse could be to use a scope assignment that overwrites the (Root(Customer), Root(Date)) tuple to server SUM aggregate function (the one you specify in the AggregateFunction property). But, as it stands, SSAS doesn’t support plugging in server aggregate functions in scope assignments.

So, we will try the reverse approach:

  1. Add a new fully-additive measure Sales with SUM aggregate function.
  2. Overwrite the Sum with LastNonEmpty at the customer level.
  3. Hide Last Sales and use Sales instead.

Scope

(

[Date].[Date].[All],

[Customer].[Customer].[Customer].Members, /*or Leaves(Customer)*/

{

[Measures].[Sales]

}

);

this = [Measures].[Last Sales]; /*assign Last Sales to Sales to make it semi-additive at customer level*/

End Scope;

Note that [Customer].[Customer].[Customer]. Members exclude the Customer All member. Since the server uses the All member to aggregate up, aggregating at a higher level, such by product will work fine because All member will contain the SUM of the last sales.

It will be great if a future SSAS release supports:

  1. Using server aggregate functions in scope assignments
  2. Give the modeler an option to control the behavior of the semi-additive measures.

SQL Server 2008 Expected Q3 2008

Francois Ajenstat, Director of Product Management for Microsoft SQL Server, tells us that SQL Server 2008 will be released in Q3 2008 while Release Candidate (RC) is expected in Q2. The February 27th marketing launch date remains unchanged.

Where Are Report Server Content Types Gone?

SharePoint always has a trick up its sleeve to surprise the innocent. I have to admit that I continue to be baffled by this technology. Not that I know too much about it, of course. But this thing is like the Pacific Ocean – web applications, site collections, sites, oh my. The further you go, the deeper it gets. Things that still escape my mind include how to get the default Office Server web site (with the Report Center, etc.) after upgrading from WSS 3.0, why I cannot implement custom SharePoint filter provider web parts in WSS given that the interfaces are in WSS, and the mother of all questions, why WSS supports Windows Server OS only.

One thing, however, I managed to figure out (of course, after hours of experimenting, installing, and head-scratching since documentation is, shall we say, wanting) is how to get the Report Server content types to show in Microsoft Office SharePoint Server 2007. If you installing a new MOSS installation, after installing the Reporting Services Add-in, the Report Server content types should show up in the site settings. However, if you are upgrading from WSS, they may not show up. The issue could be that the Report Server Integration Feature is not activated. To check:

  1. Open the site, expand the Site Actions and go to Site Settings, Modify All Site Settings.
  2. Under Site Collection Administration, choose Site Collection Features. If this is not a top-level site, you need to select the link for the Top Level Site Collection Features.
  3. Check the Report Server Integration Feature. If it is deactivated, click Activate. Isn’t this tricksy?

That should do it. You should be able to add the Report Server content types to the site.

011308_0254_WhereAreRep1

Trying to Communicate

Visual Studio 2008 embraces the exciting new world of Windows Communication Foundation (WCF) for communicating with services. However, pitfalls await the unwary. I’ve recently tackled invoking the Reporting Services Web service with WCF and I want to share my findings.

  1. The Visual Studio Add Web Reference menu has been renamed to Add Service Reference to denote that WCF can communicate with much more than Web services, including probably my Zune device. Although the dialog has somewhat changed, you will be find your way to generate the proxy.
  2. What’s more surprising is that the auto-generated proxy methods now have somewhat different signatures.

For example, the SQL Server Books Online has the following signature of the Reporting Services GetExecution Options API.

public ExecutionSettingEnum GetExecutionOptions (string Report,out ScheduleDefinitionOrReference Item);

Yet, WCF generates the following signature:

public ServerInfoHeader GetExecutionOptions(string Report, out ExecutionSettingEnum executionOption, out ScheduleDefinitionOrReference Item);

So, the returned value becomes an out parameter while ServerInfoHeader becomes a returned value. I am not sure how WCF figures this out. Does it mean that now the documentation should show both the 2.0 and WCF signatures?

  1. The second surprise wave hit me when I was trying to figure out a way to pass my credentials to the Web service. This, of course, will probably be one of the first things you need to do to invoke an Intranet service.

In the good ol’ 2.0 days, impersonating the user takes a single line of code.

rs.Credentials = System.Net.CredentialCache.DefaultCredentials;

How do we this in the shiny new WCF world? Strangely, the Visual Studio help says little about this. I came across some bizarre examples of declaring HTTP transports that made my head spin. In a sheer stroke of luck, I managed to figure out the right changes in the application config file (yes, now we have declarative settings).

<security mode=”TransportCredentialOnly“>

<transport clientCredentialType=”Ntlm” proxyCredentialType=”None” realm=”” />

<message clientCredentialType=”UserName” algorithmSuite=”Default” />

</security>

Wait! We need to tell WCF also that is OK to impersonate the user.

ReportingService2005SoapClient rs = new ReportingService2005SoapClient();

rs.ClientCredentials.Windows.AllowedImpersonationLevel = System.Security.Principal.TokenImpersonationLevel.Impersonation;

At this point, I felt like upgrading my house only to find that I have to enter through the chimney. Upgrading to a new technology shouldn’t complicate things unnecessarily. I promptly switched back to the 2.0 style of programming. Luckily, they kept the old Add Web Reference button from the advanced settings of the Add Service Reference dialog.

I guess they were right. You can’t teach an old dog new tricks…

Happy holidays!

Analysis Services Many-to-Many Dimensions: Query Performance Optimization Techniques Whitepaper Available

The Microsoft CAT team has released a new whitepaper Analysis Services Many-to-Many Dimensions: Query Performance Optimization Techniques.

“Many-to-many dimension relationships in SQL Server 2005 Analysis Services (SSAS) enable you to easily model complex source schemas and provide great analytical capabilities. This capability frequently comes with a substantial cost in query performance due to the runtime join required by Analysis Services to resolve many-to-many queries. This best practices white paper discusses three many-to-many query performance optimization techniques, including how to implement them, and the performance testing results for each technique. It demonstrates that optimizing many-to-many relationships by compressing the common relationships between the many-to-many dimension and the data measure group, and then defining aggregations on both the data measure group and the intermediate measure group yields the best query performance. The results show dramatic improvement in the performance of many-to-many queries as the reduction in size of the intermediate measure group increases. Test results indicate that the greater the amount of compression, the greater the performance benefits—and that these benefits persist as additional fact data is added to the main fact table (and into the data measure group).”

Brian Welcker Leaving SSRS

As he posted here, Brian Welcker (Group Program Manager of Reporting Services) is leaving the Reporting Services team and moving to the Microsoft Healthcare Solutions Group. Brian did so much to build and promote Reporting Services. SSRS wouldn’t have been the same if it wasn’t for Brian. The technical community (myself included) will surely miss him.

Let’s wish Brian good luck with his new career!

Relational Guide to Monitoring and Analyzing with Microsoft Office PerformancePoint Server 2007

As you know, business scorecards are the latest BI craze. Nick Barclay was kind enough to send me a copy of his new book Monitoring and Analyzing with Microsoft Office PerformancePoint Server 2007 by Rational Press which he co-authored with a co-worker and friend Adrian Downes. This is one of these relatively-small and very practical books which helps you hit the ground running quickly. As its name suggests, the book focuses only on the monitoring and analyzing piece of PerformancePoint which was previously known as Business Scorecard Manager. Nick and Adrian wrote another book, the Rational Guide to Planning with Microsoft Office PerformancePoint Server 2007, which covers the Biz# portion of the product.

I liked the author style and the practical examples included in the book. The authors show you how to build scorecards from a variety of data sources and deploy them to SharePoint or Reporting Services reports. I didn’t know that you can create a Visio strategy map and hook it to the scorecard. Too bad that the ProClarity stuff didn’t get integrated into BSM. I guess we have to wait for another release to get the cool decomposition tree when you click on a KPI. Until then, Visio strategy maps J

121607_0358_RelationalG1

Getting Rid of the Vista Credentials Prompt

There could be 1001 reasons why IE asks you for credentials when you access a website configured for Windows Authentication and none of them has to do with Reporting Services itself. Windows Vista and IE 7 add yet another one. IE 7 will prompt you for credentials if your computer is not added to a domain and you access a local website configured for Windows Authentication, such as http://localhost/reports. Thanks to the help from James Wu on the SSRS team and Bryan Noyes’s blog, the solution is simple.

  1. Open IE and go to Tools, Internet Options, Security tab.
  2. Select the Local Intranet zone. Press the Sites button.
  3. Unselect the Automatically detect intranet network checkbox and check the three checkboxes below it.
  4. Restart IE. Now http://localhost/Reports or http://localhost/ReportServer shouldn’t prompt for credentials.

120607_2346_GettingRidO1

If it still prompts and you have SQL Server 2008 installed, it could be an issue with Kerberos. To fix this, open the ReportServer configuration file (rsreportserver.config). Locate the following section:

<Authentication>

<AuthenticationTypes>

<!–RSWindowsNegotiate/–>

<RSWindowsNTLM/>

</AuthenticationTypes>

<EnableAuthPersistence>true</EnableAuthPersistence>

</Authentication>

Comment the <RSWindowsNegotiate/> element or remove it, so only <RSWindowsNTLM/> is enabled.

Performance Improvements for MDX in AS 2008

Here is a useful page from the SQL Server 2008 BOL that summarizes the SSAS performance improvements in Katmai pretty well. It also shows which functions are optimized. For example, the Lag function wasn’t optimized in 2005 but now is.