Fast Track To Enterprise Resource Planning (ERP) Analytics

Enterprise Resource Planning (ERP) systems capture a wealth of information from main business processes within an organization, such as Sales, Inventory, Orders, etc. Therefore, a BI journey typically starts with analyzing the ERP data, with revenue analytics usually taking the center stage because of vital metrics, such Revenue, Margin, Profit. In fact, this scenario has repeated so often for the past few years that Prologika has developed a fast-track implementation for ERP analytics. The client presented in this case study had more complicated integration needs, but other projects for both larger and smaller organizations have benefited from the same methodology.

Business Needs

NSi Industries manufactures and distributes electrical components. The company has grown rapidly through acquisitions, with every business unit having its own ERP system, including Dynamics and other business-specific ERPs. Some ERPs were installed on premises, such as Dynamics that stores data in a SQL Server database on the company’s data center, and others were cloud systems.

NSi realized that it’s difficult to analyze performance across business units. They envisioned a centralized and fully automated reporting solution that will consolidate data from all ERPs into a single repository so they can track sales across business units, sales people, vendors, and customers. In addition, they wanted their developers to enhance and maintain the solution, so simplicity and knowledge transfer were paramount.

Solution

After assessing the current state and objectives, Prologika recommended and implemented the following cloud architecture:
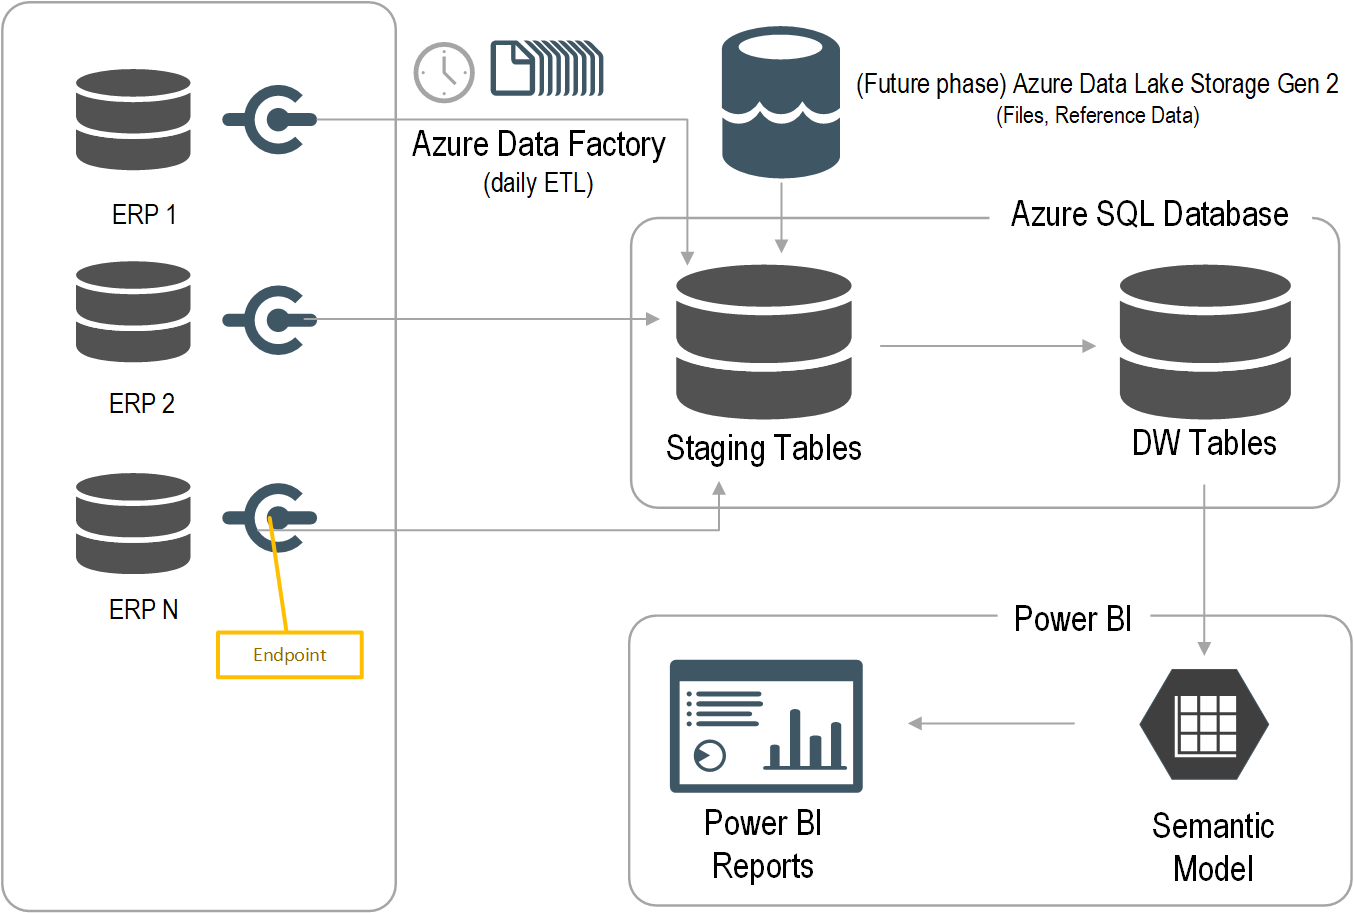
Prologika adopted an iterative approach to integrate the data from all five ERP systems where each ERP had its own iteration. Laying out the foundation, the first iteration was the most important and had the following main deliverables:

  1. Schema-first design – Prologika analyzed the requirements for Sales analytics and designed a star schema. The schema design was crucial because all other layers, such as ETL and semantic model, depend on it.
  2. Endpoints – Prologika worked with the ERP subject matter expert to implement endpoints that will provide a data feed for each table in the schema.
  3. ETL– Prologika used Azure Data Factory (ADF) no-code pipelines. The integration effort was dramatically reduced because all ERP endpoints would adhere to the same specification and hide the underlying details for each specific ERP, such as which tables would need to be joined. For best performance and fast knowledge transfer, Prologika followed the ELT pattern to transform and load the staged data using T-SQL stored procedures.
  4. Data warehouse – Prologika staged, transformed, and loaded the data into a centralized data warehouse repository whose structure was based on the star schema design in step 1.
  5. Semantic model – Prologika implemented a Power BI semantic model that delivered instantaneous insights and single-version of truth irrespective of the reporting tool used (Power BI, Excel, or third-party tools). The semantic model included the desired business metrics, such as time intelligence, variances, as well as data security.
  6. Reports – Power BI report “packs”, such as Sales Analytics, Order Analytics, were developed that connected to the semantic model. Users also could use Excel and other tools to create pivot reports without extracting and duplicating data.

Benefits

The solution delivered the following benefits to the client:

  • Fast data integration – Each subsequent ETL iteration could benefit from the common architecture.
  • Data consolidation – Data was consolidated into a single repository.
  • Low licensing cost – The solution had a licensing cost in the range of $400/month.
  • Easy maintenance – The client was able to quickly learn and enhance the solution.

The US Largest Laboratory Network Gets Consolidated Reporting

LabCorp operates one of the largest clinical laboratory networks in the world. It also has an Interactive Response Technology system that healthcare vendors can use to conduct case studies.  Thanks to the cloud data analytics solution implemented by Prologika, LabCorp and its vendors can now analyze data across case studies.

Business Needs

The data for each study was saved into a separate on-prem SQL database. The total number of databases was more than 1,000. After the initial assessment, Prologika realized that one of the main gaps was that vendors couldn’t report across their studies or gain performance insights from studies conducted by other vendors. Further, as the IRT system evolves over time and to accommodate special requests, there were scheme differences between different versions.

LabCorp underscored the importance of consolidating the data from multiple studies into a single repository. They envisioned a cloud-based PaaS BI solution that would extract data from all the on-prem databases without impacting the system performance and centralize it into an enterprise data warehouse. Vendors would log an external portal that will deliver embedded reports. The first iteration was focused on analyzing audit and log data to gain strategic insights, such as how many users are using the system.

Solution

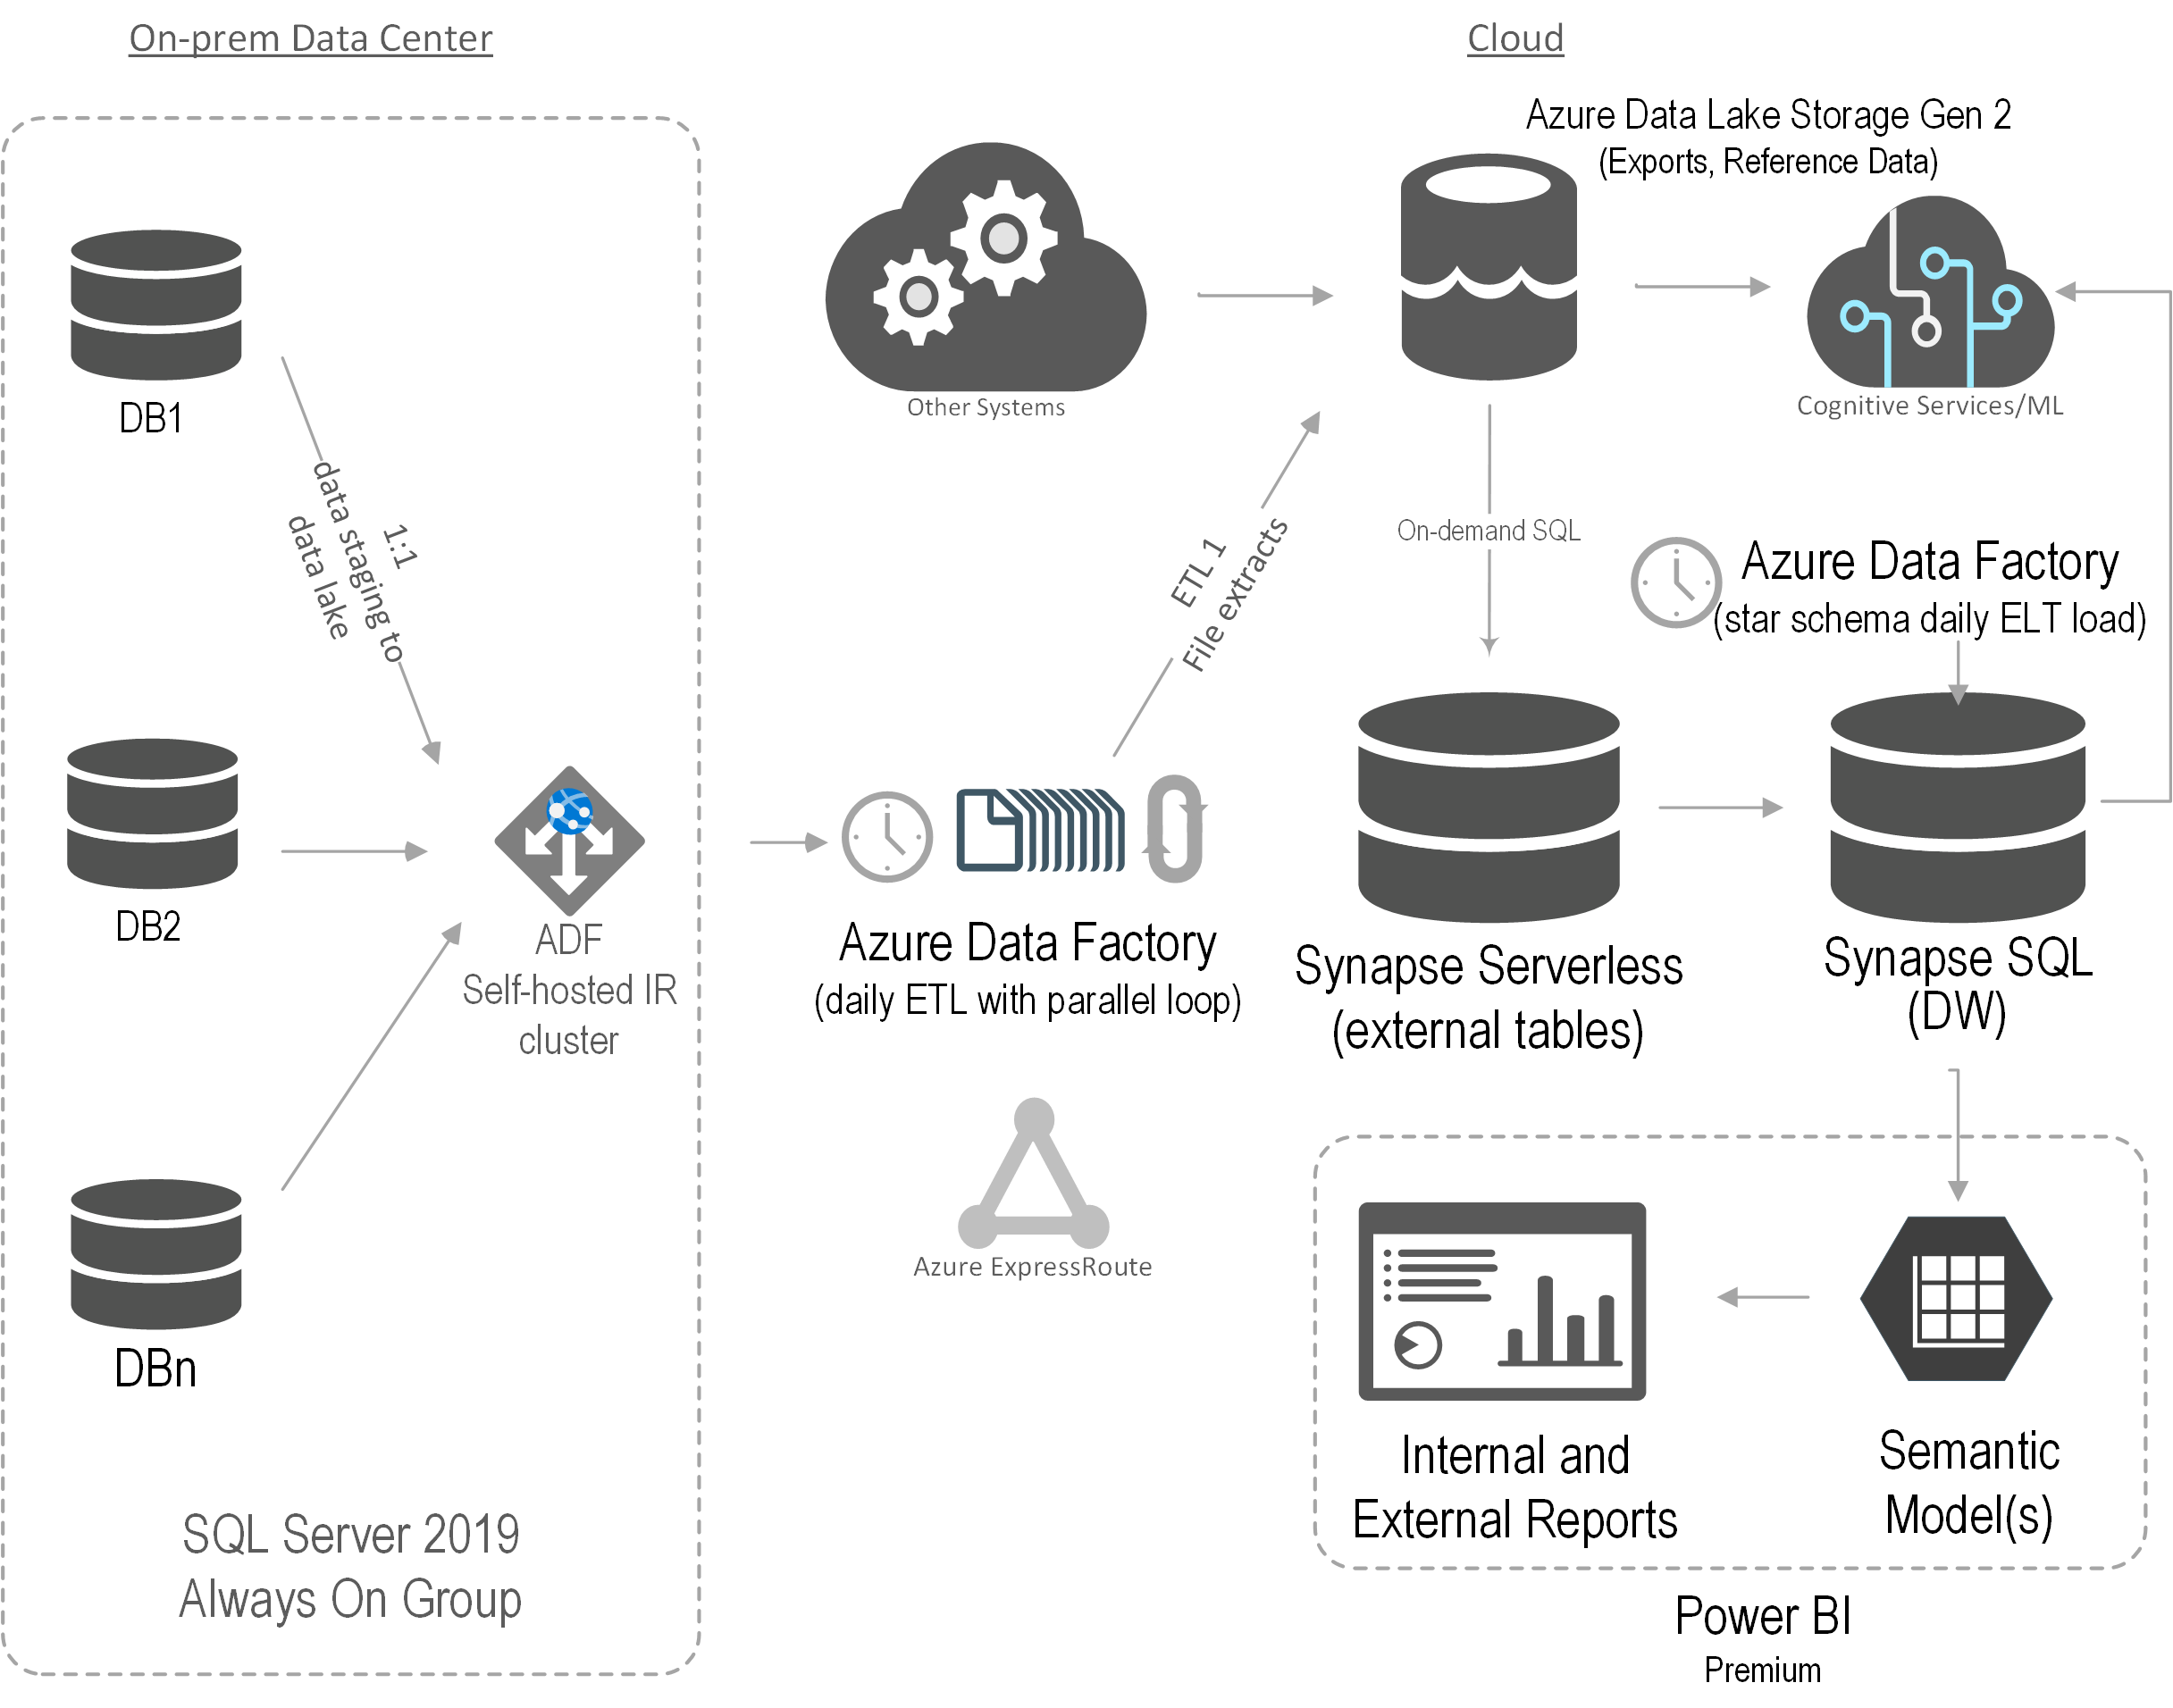
After assessing the current state and objectives, Prologika recommended and implemented the following architecture:

Prologika implemented an Azure Data Factory (ADF) configurable framework to extract data from the on-prem databases hosted on two production SQL Servers in parallel. The framework would stage the data into partitioned parquet files in Azure Data Lake Storage (ADLS).

Then Prologika created views in Synapse Serverless to consolidate the file extracts. For example, an Audit table could exist in several on-prem databases on both production servers. While each table would be staged in a separate file (or multiple files if the table supports incremental extraction), a Synapse Serverless would present a consolidated view across all files. We were impressed by the capabilities and performance of Synapse Serverless.

Another ADF process would extract the data from the Synapse Serverless views and load the data into a data warehouse hosted in a Synapse SQL pool. Although we considered other methods, such as using a linked server in a Azure SQL Managed Instance to Synapse Serverless to avoid data staging, we settled on Synapse SQL mainly for its scalability. Finally, a Power BI semantic model was created and Power BI Embedded used to deliver reports.

Benefits

The solution delivered the following benefits to LabCorp:

  • Data consolidation – Data was extracted with minimum impact to the operational systems and consolidated in ADLS.
  • Data virtualization – Thanks to the Synapse Serverless flexible support of schema differences, virtual views were created.
  • Scalability – Synapse SQL pool can scale almost indefinitely.
  • Secure and fast insights – Each vendor can access only their data.

State Health Department Gains Reliable and Rapid COVID Insights

Thanks to the BI solution implemented by Prologika, the Houston Health Department gains reliable and timely insights from COVID lab results.

Business Needs

Amidst the coronavirus pandemic, the Houston Health Department (HHD) had another predicament to tackle. With lab results accumulating rapidly at one million cases per month, the vendor system they used for capturing and analyzing COVID data couldn’t keep up. The SQL Server database had large tables with normalized name-value pairs for each question and answer received from the patient, and for each investigation result.

To facilitate reporting, the vendor system had scheduled ETL processes to extract data from the OLTP tables into denormalized tables. However, locking conflicts and large data volumes would crash the system and fail the ETL processes. As a result, business analysts were not able to get timely data for reporting. HHD and the vendor tried to isolate the reporting loads by replicating the data to a reporting database but the issue with populating the denormalized tables remained.

Solution

A good BI solution starts with a solid foundation.

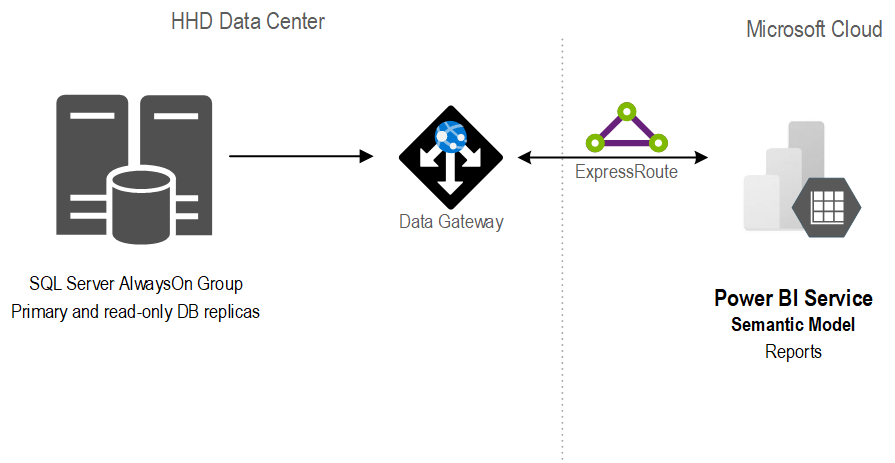
After assessing the current state and objectives, Prologika recommended and implemented the following architecture:

The stand-alone SQL database was replaced with an AlwaysOn availability group. Not only did this provide high availability, but it also isolated operational from reporting workloads. In the client own words ” we have compared the cluster server to the report server and cluster is vastly superior with regard to performance for regular queries. One simple run was 4x faster on cluster than the current report server. A much more complex run took four minutes on cluster and I stopped the same run on the report server after 87 minutes”

Previously, data analysts would produce reports using different tools, ranging from SQL, Python, to Power BI reports. With scarce resources, HHD found it difficult to continue that path. Instead, Prologika implemented a semantic model that was hosted in Power BI.

Benefits

The new architecture and semantic model delivered the following benefits to HHD:

  • A single version of truth – Strategic data and business calculations were centralized on one place.
  • Fast insights – The Power BI reports crunching millions of rows were instantaneous.
  • Isolation – Report loads were isolated from the operational loads because the data was cached in the semantic model.
  • Standardization and centralization – Power BI became the reporting platform for delivering insights across the organization.

Public School District Gets Insights from Microsoft Teams

Fulton County Schools gained important insights of how teachers and students utilize Microsoft Teams for Education.

Business Needs

During the COVID-19 crisis, Fulton County Schools (FCS) transitioned from traditional classroom content delivery to online digital teaching and learning. FCS adopted Microsoft Teams for Education as an online platform to foster collaboration between teachers and students. However, FCS struggled for a long time trying to obtain the necessary data from Microsoft Teams to analyze how effectively teachers and students utilize Microsoft Teams in these challenging times. The Microsoft-provided Office 365 Usage Analytics for Power BI didn’t provide the depth of information FCS needed, such as to analyze counts of assignments that teachers give to students and submissions that students prepare for an assignment. FCS also wanted to understand about how often teachers and students meet and for how long.

Solution

More and more organizations are switching to Microsoft Teams mostly for online meetings. However, Microsoft Teams can deliver much more than that. We found that Microsoft Teams is a powerful and extensible platform. For example, Microsoft has provided add-ons for common verticals, such as Teams for Education. Microsoft Teams can be further enriched with apps. When teachers and student collaborate in Microsoft Teams for Education, the data is stored in SharePoint Online. Most of the Microsoft Teams data is exposed via a single data source: Microsoft Graph API.

Unfortunately, calling Graph APIs directly from Power BI was not a feasible option because of the complexities surrounding Graph programming, such as different authentication requirements (delegated and application permissions), data paging (most Graph APIs return 100 records per call), and exception handling. As we found out, processing the data sequentially would have taken some 24 hours which would have been impractical for Power BI dataset refreshes.

Our BI solutions help clients implement a digital feedback loop and act upon the data. The process starts with acquiring the necessary data and designing a comprehensive data model that can answer important business questions. Then, the client applies the insights to improve their processes. This leads to a powerful feedback mechanism where outputs are routed back as inputs to business.

Prologika developed a custom app to extract the required data by calling the Microsoft Graph APIs. The app supported a configurable degree of parallelism to process data in parallel. This reduced the duration for the full load to less than 9 hours. In addition, incremental daily ETL decreased the extraction time even further. The data was saved in a relational database consisting of several entities, such as Schools, Classes, Assignments, Submissions, and Events. Data availability led to data analytics. Power BI reports were implemented to deliver important insights, such as the interactive report below.

Benefits

Prologika helped FCS to gain important insights of how teachers and students utilized Microsoft Teams for Education. The key solution benefits were:

  • Automated daily retrieval of Teams data
  • Enabled a digital feedback loop to learn from the gathered insights and improve operations
  • Ability to analyze educational data by various perspectives (school, class, teacher, student, assignments, submissions and events)

Brightstar Improves Business Performance Management

Brightstar improved their Business Performance Management processes with a customized solution developed by Prologika.

Business Needs

Business Performance Management (BPM) is a methodology to help the company predict its performance. An integral part of a BPM strategy is a process for Budgeting, Planning, and Forecasting which is typically performed by the Finance department. When it comes to Finance, nothing is simple and BPM is no exception.  The temptation is to buy a prepackaged software but even that route would require a lot of customization and compromises. To gauge complexity, let’s look at some of the business requirements Prologika faced.

090917_2102_PrologikaNe2.png

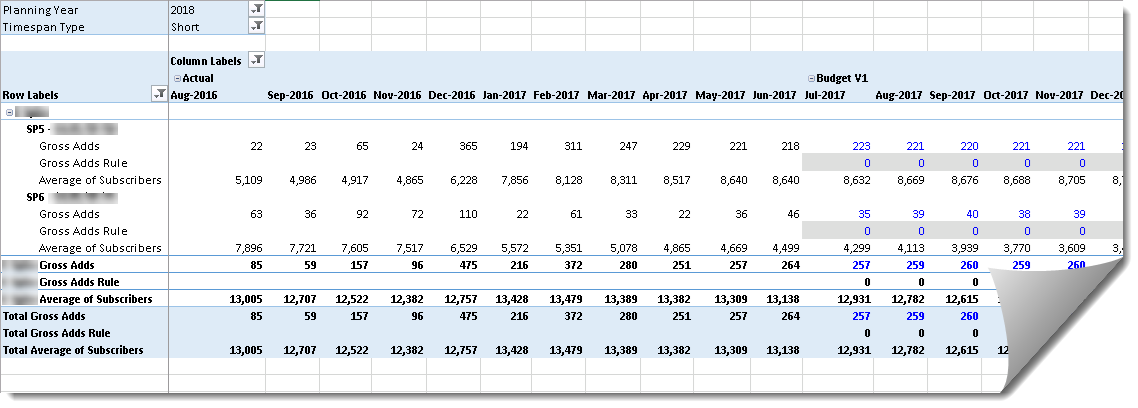
Similar to a Telco, this company has customers and service plans. As a B2B organization, their customers are other companies. Planning is done at the customer and service plan level, and across multiple subject areas. For example, the Excel report shows a subset of the measures for planning growth of the customer base.  The planner can change the budget and forecast values of some measures, called drivers. For example, the planner can overwrite Gross Adds for future periods. Further, the planner can overwrite a rule in each cell to change how the driver cell value is computed. The rules are:

  • 0 (default rule) – By default, planned values are calculated as 3-mo average of previous periods. For example, Gross Adds for Aug 2017 for the first plan is 221 and has a Gross Adds Rule of 0. This means that the system will calculate the value as a 3-mo simple average of the values of the previous three months (221, 218, and 223). Note that a previous month might fall in the Actuals range. Also notice that recursive calculations are required, where the value of each month is based on the same measure for previous periods.
  • 1 (6-mo average) – Instead of 3-mo average, 6-mo average is used.
  • 2 (seasonality index) – The value is computed by multiplying the driver values for the past 12 months by a seasonality index.
  • Any other value – The planner enters the driver value manually.

The driver measures are used to calculate other (output) measures. For example, Average of Subscribers has a formula that is based on Gross Adds and other measures. Finally, the drivers and output measures are allocated across a Chart of Accounts dimension (not shown on the report) to give managers the financial perspective of how the company is doing.

Solution

Previously, the company has used an Excel-based home-grown solution for BPM . However, the process was manual, lengthy, error-prone, and it couldn’t give management a quick and accurate picture of the company’s performance. A Business Analytics group was responsible for retrieving and consolidating actuals. Then, the Finance group would manually input actuals into an Excel template. Complicated Excel formulas were used to calculate drivers and output measures but even Excel had difficulty with more complex recursive measures. Most of the time and effort was spent on working the system than on business performance management. The company looked at other high-end financial solutions, with a starting price tag of $300K, plus yearly maintenance fees and consulting feeds. At the end, the company entrusted Prologika to implement the solution.

We used Analysis Services 2016 Multidimensional, Initially, we considered Tabular but we realized that the solution complexity exceeded the Tabular capabilities, including:

  • No support for writeback – Currently, Tabular doesn’t writeback although third-party solution such as Power Planner can be overcome this limitation.
  • No support for recursive measures – Currently, Tabular doesn’t support recursive measures, where the measure DAX formula references the same measure.
  • No scope assignments – Tabular doesn’t support scope assignments for allocations.
  • No parent-child dimensions and hierarchy functions – Tabular doesn’t support parent-child hierarchies and functions for navigating the hierarchy, such as Parent, Children, etc.

Benefits

Prologika helped Brightstar to transform its BPM processes.

  • Automated retrieval of actuals from the company’s data warehouse (also designed by Prologika)
  • A highly-customized solution that meets complex business needs
  • Management has immediate access to actuals, budget, and forecast
  • Elimination of manual entry and data errors.
  • Ability to analyze company’s performance by various perspectives (customer, service plan, time, chat of accounts).


ZynBit Empowers Sales with Microsoft Power BI Embedded

ZynBit incorporated Power BI Embedded into their offering to drive value to their customers and increase monetization opportunities for sales and marketing teams.

Business Needs

ZynBit connects all of your sales and marketing Bits to help companies transform teams into what we call “Sales Nerds”. The next generation of sales pros are 1-part sales engineer, 1-part customer success and 1-part data analyst. Customer buying behavior is changing – consumers and buyers are heavily researching their vendors way before the first sales interaction ever happens, forcing sales teams to rethink how they operate.

In fact, a recent Corporate Executive Board study shared by the Harvard Business Review stated that, on average, nearly 60% of a typical purchasing decision—researching solutions, ranking options, setting requirements, benchmarking pricing, and so on—happens before even having a conversation with a supplier.”

Solution

ZynBit is hosted on the Azure Microsoft Cloud, which offers performance, scalability and security. Power BI Embedded was a natural fit with its ability to help ZynBit customers visualize customer data. ZynBit evaluated several solutions, focusing on user experience and design, the ability to tell stories with data, and ease of integration to the ZynBit platform.

Power BI Embedded offers a flexible pricing model with no upfront investment for developers, which is great for developers who need time to test and validate their product ideas. The pricing model is also nicely positioned for scale with a consumption model, which makes it easy to calculate and integrate into ISV subscription plans.

Benefits

Prologika helped ZyhBit to transition their data model from Tableau to Power BI and to integrate Power BI reports with Power BI Embedded.

  • The multi-tenant system reduces maintenance
  • Row-level security ensures that the user can access only the data they are authorized to see.
  • Power BI Desktop helps minimize data engineering and development cycles.
  • Out-of-the-box UX supports interactive and dynamic filters, which was a great value add for our customers.
  • The integration with ASP.NET allowed ZynBit to use the Microsoft server side libraries to easily embed dashboards in our ASP.NET MVC pages. Hosting Power BI Embedded reports was extremely easy with Azure.

Customer satisfaction

ZynBit launched in 2015 and didn’t charge initially, because ZynBit wanted to garner as much feedback from potential customers as possible. Now they have  over 4,000 customers across the world using ZynBit to increase sales and deliver a better customer experience. Prospect and customer insights was always at the core of the ZynBit mission . The front end user experience is delivered through Outlook and Gmail and the backend platform is built on the Microsoft Azure Stack for security and scale. The customer was extremely pleased to know Microsoft would be launching Power BI Embedded for developers and now Power BI is part of the ZynIQ user experience.

Fortune 50 Company Rolls Out Microsoft BI Across the Enterprise

Excel Power Pivot and Power BI caught like a wild fire within our organization. Microsoft BI empowers our users to travel the entire continuum from self-service BI, team BI, to enterprise BI on a single platform like never before.

Data Architect

This organization wanted to empower business users to analyze their data without reliance on IT. Prologika delivered advisory services to help them plan and roll out Microsoft organizational and self-service BI across the enterprise.

Business Needs

A large organization wanted to adopt Microsoft BI across the enterprise. Historically, it was difficult for IT to meet the growing analytical needs of thousands of business users. Instead, the organization wanted to empower users in all units to gain access to their data and share the BI artifacts they produce in a controlled and secured manner.

The organization wanted to standardized its organizational BI as well. After evaluating several vendors, they decided to adopt the Microsoft BI platform for both self-service and organizational BI. Prologika was awarded the project and was entrusted to help the organization plan and adopt Microsoft BI across the enterprise.

Solution

The Prologika team, consisting of several Microsoft Most Valuable Professionals (MVPs) and industry experts, delivered a set of advisory documents for data architects and executive stakeholders. The first set of documents provided documented processes and best practices that will be utilized for action to effectively implement and support self-service BI, including comparing the tool capabilities, recommending the best Microsoft BI tool for a proposed use, designing and scaling a Microsoft SharePoint BI infrastructure environment, and managed self-service BI best practices.

The second set of documents detailed comprehensive data strategy recommendations, including comparing Microsoft BI data structures, change strategy, monitoring strategy, capacity planning, data quality and master data management, with the goal to utilizing the organizational Microsoft BI platform to deliver a single version of truth.

The third set of documents focused on security and included security best practices that covers the Microsoft SharePoint Enterprise environment with an underlying SQL Server Analysis Services Data Structure and security for deploying self-service BI models to SharePoint.

Prologika also delivered staffing and training documents that detailed the staffing requirements for different BI user types, and training requirements. Prologika also conducted Power BI training classes to train business users on self-service BI with Excel and SharePoint.

Benefits

Under the guidance from Prologika, this organization democratized and open BI to everyone on a single platform – Microsoft BI. It enabled the self-service, team, and organizational BI continuum. Now, a business user can use Excel to create a self-service BI model and deploy to SharePoint, and then share it with his teammates in a controlled and secure environment. If the data model gains popularity, IT can convert the model to an Analysis Services organizational model that is sanctioned and managed by IT.

Empower business users

Business users from all units gain valuable data insights with the tool they use every day – Microsoft Excel. A business user can connect to whatever the data resides, import it in an Excel data model, and create ad hoc pivot reports to perform descriptive analytics. Then, the user can deploy the data model to an enterprise SharePoint farm that is dedicated to BI. Other users can view and interact with the Excel web reports without requiring Excel to be installed locally.

Business users no longer rely on IT to produce paginated reports. Now the role of IT is to facilitate and supervise self-service BI. The best practices we delivered helped IT to establish a scalable and trustworthy environment.

Implement powerful organizational BI solutions

Microsoft BI enabled IT to create powerful solutions for analyzing huge data volumes. For example, management wanted to analyze the data during the peak season in almost real time. A SQL Server data mart was developed to store the operational data within a given retention period. An Analysis Services cube was layered on top of the data warehouse to provide users with instant insights to detect abnormalities, such as longer delivery times, and react immediately to meet SLA contract terms.

Reduce licensing costs

Typically, large organizations tend to accumulate a variety of software tools and this organization is no exception. They still use the best-of-breed tools for specific needs, such as to plot point-to-point routes on a map. However, they realized that using the tools that they already have, allows them to reduce licensing and training costs.


Insurer Improves Operations with Master Data Management

AXIS Capital, a large property and casualty insurer, was looking for ways to improve the data quality and management of important data entities. Prologika implemented an MDM solution powered by Microsoft SQL Server Master Data Services (MDS) that allows business users to conveniently manage master and reference data in Excel.

Business Needs

Proper data governance is a critical issue for AXIS. Management realized that maintaining a single source of truth (a master database) can help them understand their operations better. That’s because the thorniest problem was traced back to the multiple legacy core systems. Historically, there hasn’t been an easy way to reconcile the differences between disparate source systems and offers organizations an environment within which they might view and manage a “golden copy” of enterprise data.

In addition, regulatory compliance has been an important concern as large U.S. companies now spend millions of dollars on regulatory compliance. AXIS was looking for ways to standardize data in order to ensure compliance.

Solution

Prologika implemented a solution for managing master data and reference data powered by Microsoft SQL Server Master Data Services (MDS). Prologika wrote ETL processed to extract data from different business segments (subsidiaries) and consolidate the data in MDS. Corporate hierarchies were created to define logical data exploration paths.

AXIS formed a data governance group whose members, from finance and IT, would be the data stewards. The group was tasked to figure out how each business subsidiary’s data definitions would transform into standardized datasets that could be standardized and imported into the MDM system.

Now a data steward can use Microsoft Excel to manage important master and reference data inside the tool they use every day. Multiple subscribing systems integrate with MDS to import the master data. For example, the company’s data warehouse imports several dimensions from the corresponding MDS entities.

Benefits

Using the master data management solution developed by Prologika, AXIS improved the data quality of master and referenced data. Historically, large organizations have spent millions of dollars on MDM solutions with questionable returns. Our cost-effective approach helped AXIS save implementation costs and delivered the MDM solution within a few months.

Improving operations

Effective master data management save the company time and money. The result is much more than just clean data. MDM offers AXIS a “single version of the truth” gathered from desperate databases.

Increasing insight

Organizations that maintain a single source of truth(master data) always understandtheir operations better than those that don’t. Clean, accurate data improves the company’s ability to track, measure, and interpretorganizational performance, so it can make betterbusiness decisions.

Ensuring compliance

By standardizing and reconciling main entities, master data management helped the company assure regulatory compliance with regulations, such as the Sarbanes-Oxley Act.


Insurance Company Improves Data Quality

Berkley Specialty Underwriting Managers (BSUM) wanted to improve its data analytics processes by transitioning from self-service to organizational BI. Prologika implemented a classic organizational solution, consisting of a data warehouse, ETL, and a cube that allows users to gain insights with Excel ad hoc reports. ETL processes extractssource data, transforms it, and loads the data warehouse.

Business Needs

BSUM understood that data analytics can help management better understand the company business and be more competitive in the crowded insurance space. Previously, the company attempted to use self-service BI tools but found that the complexity of analytical requirements surpassed the skillset of business users and capabilities of self-service BI tools. Management realized that an organizational BI solution is preferable because it can deliver a single version of truth. This required implementing ETL processes to transform the raw data into a star schema.

BSUM has multiple operational systems for creating policies and processing claims. Over the years, different versions of SQL Server Integration Services (SSIS) were used, ranging from DTS 2000 to SQL Server 2012. Management wanted to standardize all ETL packages on SQL Server 2012 to reduce developer and maintenance effort.

Solution

Prologika designed and implemented an organizational BI solution, consisting of a data warehouse, cube, and ETL. Prologika used its home-grown ETL framework that supports configurable degree of parallelism when running packages in parallel. Depending on the target ETL server, BSUM can configure the framework to paralyze the package execution over a certain number of threads. As a result, the ETL processing window is greatly reduced to a few hours for a full historical load and about 15 minutes for the daily load. The framework also supports incremental extraction for the daily load.

Prologika consultants worked on migrating the BSUM legacy packages to SSIS 2012 with the goal of having all packages converted to SSIS 2012. Not only were the packages converted, but also they use the SSIS 2012 project deployment mode that greatly simplifies ETL development and monitoring.

Benefits

ETL takes 60-80% of the effort for implementing an organizational BI solution. Therefore, it’s important to follow best practices so you don’t end up with an intangible mess of ETL code and you don’t exceed your ETL processing windows. For more information about ETL best practices, read our “Is ETL (E)ating (T)hou (L)ive?” newsletter.

Reduced ETL window

Data is rapidly growing nowadays while ETL processing windows are shrinking. You must do more with less. And, ETL usually becomes a performance bottleneck that stands in the way of your current and future BI initiatives. One way to reduce ETL windows is to run packages in parallel.

Many ETL tasks, such as ODS loads, loading dimensions and independent fact tables, can benefit greatly from parallel execution. The Prologika framework supports a configurable number of parallelism and distributes the packages across parallel flows.

Reduced maintenance effort

Because all packages target SSIS 2012, BSUM standardized its ETL processes. Monitoring and troubleshooting ETL is simplified because the SSIS 2012 project deployment supports task-level performance analysis in addition to easier development.


Records Management Firm Saves $1 Million, Gains Faster Data Access with Microsoft BI

With the SQL Server 2012 data warehouse, we won’t need disk arrays in each data center to handle all of that extra volume. This alone will save us $500,000.

Todd Pinniger, Senior Manager of Architecture and Product Development

Recall, a records-management firm, needed faster access to key performance indicators and more intuitive business intelligence (BI) tools. The company consolidated four data centers into a Microsoft SQL Server 2012 data warehouse. The solution’s performance enhancements speed employee access to more detailed data. By consolidating into a data warehouse, the company saved $1 million in hardware and licensing costs.

Business Needs

Recall provides records-management solutions to a worldwide customer base that includes more than 50,000 law firms, banks, governments, healthcare providers, financial firms, and other companies. The company stores paper, digital, and tape files securely or it destroys them as directed by customers.

To support agility and growth, Recall needs to be able to access current key performance indicator (KPI) information about its records inventory, customers, and operations. Previously, to obtain company-wide information, Recall had to synchronize data stored in 35 databases at four regional data centers, including several multi-terabyte databases. The synchronization process was so time-consuming and labor-intensive that company metrics could only be updated once a month. This delay made it difficult for the business to make decisions or answer shareholder information requests as quickly as it wanted to.

The company’s ability to analyze its data was also limited. To perform custom analysis, IT employees had to run reports against all 35 databases worldwide and import the results into a spreadsheet tool, a process that could take weeks.

Solution

Recall considered BI solutions from Panorama, CORDA, QlikView, Tableau, and SAP. The company ultimately decided to base its new solution on Microsoft SQL Server 2012 Enterprise data management software running on the Windows Server 2008 R2 Enterprise operating system. “We were already using Microsoft technology for many critical company systems, so we were very familiar with the environment and confident about its reliability,” says Todd Pinniger, Senior Manager of Architecture and Product Development at Recall.

With help from Microsoft partners Prologika and Berg Information Technology, Recall started deployment in August 2011 and went into production in February 2012. Recall also has 24-hour access to Microsoft Services Premier Support for help resolving problems. The solution includes a cluster with two active nodes, one with SQL Server 2012 Analysis Services and the other running SQL Server 2012 Integration Services. Microsoft SharePoint Server 2010 and SQL Server 2012 Reporting Services run on a second, load-balanced cluster. The software is installed on Dell PowerEdge R810 server computers attached to an EMC Symmetrix storage area network.

The new data warehouse holds about 7 terabytes of data in three databases of about 3 billion rows apiece. The company is using the Microsoft SQL Server 2012 xVelocity memory-optimized columnstore index feature, which speeds the processing and querying of very large data sets by storing index data in columns, not rows.

“Before, certain queries were taking longer than we wanted,” says Carlos Rodrigues, a Business Intelligence Architect at Recall. “After we started using the xVelocity columnstore index, those queries dropped from about 20 minutes to less than 2 minutes.”

Recall has access to additional performance enhancements in SQL Server 2012, such as compression capabilities that can cut data volumes by 50 percent and the SQL Server 2012 Resource Governor, which helps administrators achieve more predictable performance.

For self-service BI capabilities, Recall is using Microsoft SQL Server 2012 Power View, an interactive data exploration and visualization feature in SQL Server Reporting Services that operates in SharePoint Server 2010. Recall is also taking advantage of PerformancePoint Services in Microsoft SharePoint Server 2010, which provides simple tools for building reports, scorecards, and dashboards for monitoring KPIs. The tools are used regularly by approximately 400 analysts and managers.

Benefits

By deploying a SQL Server 2012 solution, Recall has cut costs by U.S.$1 million. Decision makers now have faster access to critical company information, and the IT department has less manual work to do.

Saves $1 Million in Hardware and Licensing Costs

Because the new solution eliminates the need to replicate huge volumes of data in each of the company’s four regional data centers, Recall will no longer need to purchase and maintain as much hardware. “With the SQL Server 2012 data warehouse, we won’t need disk arrays in each data center to handle all of that extra volume,” says Pinniger. “This alone will save us $500,000.”

By consolidating its data warehouses, Recall will also reduce its number of SQL Server licenses. “With a global data warehouse based on SQL Server 2012, we will be able to go from 12 to 4 licenses, saving another $500,000,” says Rodrigues.

Speeds Access to Critical Information

The new solution provides much faster access to KPIs and other reports. “With our previous solution, certain metrics were only updated every month,” says Rodrigues. “With the SQL Server 2012 data warehouse, decision makers no longer have to wait until the end of the month and can instead access updated information on a daily basis. That keeps the business agile and helps us respond more quickly to shareholder requests.”

Cuts Manual IT Workloads

With all of the company’s data in one central repository, performing custom analysis no longer requires intensive effort by IT employees. “Before, it could take as long as two weeks to manually pull data from all 35 local databases, import it into another database, and then run queries against it,” says Pinniger. “And if, after that process, the business wanted to slice that data slightly differently, we would have had to start over. Now, with the SQL Server 2012 data warehouse and xVelocity, that two-week process has been reduced to about an hour’s work, which the business users can perform themselves.”