MVP For 15 Years!

Got awarded for Microsoft Most Valuable Professional (MVP) – Data Platform again. This will make my 15th consecutive year to be recognized by Microsoft for my expertise and contributions to the community! Learn more about the MVP program at https://mvp.microsoft.com/en-us/Overview.

MVP_Logo_Horizontal_Secondary_Blue288_CMYK_72ppi

Another Successful Power BI Workshop

Thank you to everyone attending the Power BI workshop by Prologika yesterday. We had another great turnout with more than 50 people from 30+ companies attending the event at the Microsoft Technology Center in Alpharetta! Kudos to Eric Flamm and Michael Folarinde for the great job proctoring the event. Here is some feedback that the attendees shared in the post-event survey:

  • “I was frustrated and confused with using Power BI service and Desktop because I didn’t know how to manipulate the visualizations, slicers, etc. and thought the tools were not capable. I walk away from this now knowing this information and excited to use the tools to transform data to help our business.”
  • “Very informative and showed me new things despite me using PBI for a few months.”
  • “Very instructive and knowledgeable of our instructor Teo. He is very patient and answered all my questions.”
  • The presenter was great. He was obviously very knowledgeable, was great at explaining the concepts, and was very patient.”
  • The presenter, Teo, was extremely knowledgeable of Power BI. He presented the material in a clear and easy to follow format. He was able to answer all levels of questions from beginner to advanced and even questions regarding infrastructure and how to implement Power BI into small or large organizations. I really enjoyed that we were given time to actually perform the various tasks ourselves and then get help along the way. It really helped to reinforce the lessons we had just learned.”
  • “…The instructors were very helpful with any questions.”

And my next week is entirely booked with more Power BI training. It’s great to witness and participate in the great momentum surrounding Power BI!

051118_2048_AnotherSucc1.jpg

Prologika AppSource Consulting Offers

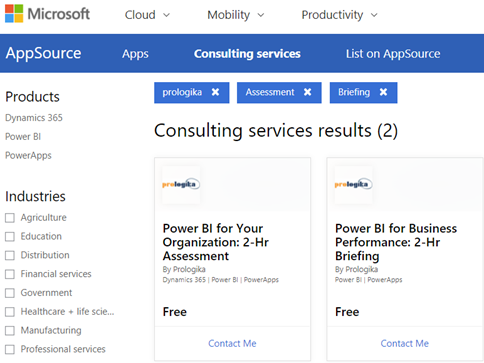
Microsoft selected and published two Prologika Power BI-related consulting offers on Microsoft AppSource. And their price is right; they are both free!

  • Power BI for Your Organization: 2 HR Assessment – Prologika will evaluate your data analytics objectives to determine how Power BI can empower your organization to understand better and improve its business.
  • Power BI for Business Performance: 2-Hr Briefing – Prologika will provide you with a free, 2-hour briefing on how our client derived tremendous value from our solution for Business Performance Management. Learn how Prologika transformed the way a large organization does financial planning by creating and comparing budgets and forecasts with our customized solution based on the Microsoft Data Platform and Power BI.

Applied Power BI Book (3rd Edition)

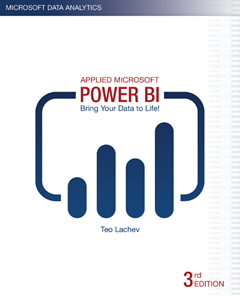
I’m excited to announce the third edition of my Applied Microsoft Power BI book! When the original book was published  in January 2016, it was the first Power BI book at that time. Since then, I helped many companies adopt or transition to Power BI, and taught hundreds of students. It’s been a great experience to witness the momentum surrounding Power BI.

The third revision added more than 20% new content (the book is now 426 pages) and probably that much content was rewritten to keep the book up with the ever-changing world of Power BI. Because I had to draw a line somewhere, Applied Microsoft Power BI (3nd edition) covers all features that were that were released by early December 2017. As with my previous books, I’m committed to help my readers with book-related questions and welcome all feedback on the book discussion forum on the book page. While you are there, feel free to check out the book resources (sample chapter, front matter, and more). I also encourage you to follow my blog at https://prologika.com/blog and subscribing to my newsletter at https://prologika.com to stay on the Power BI latest.

How to get THE Power BI book?

  • Amazon paper copy (should be available next week)
  • Amazon Kindle ebook
  • Other popular channels coming up shortly

Bring your data to life for a third time! Keep on reading and Happy New Year!

123117_1605_AppliedPowe1.png

MVP For 14 Years!

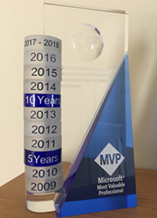
Got awarded for Microsoft Most Valuable Professional (MVP) – Data Platform again. This will make my 14th consecutive year to be recognized by Microsoft for my expertise and contributions to the community! Apparently, it became difficult (or not cost effective) to count years, so the ring is for 2017-2018 but the tower doesn’t lie.

Gartner’s 2017 BI and Data Analytics Magic Quadrant Shows Microsoft Leading

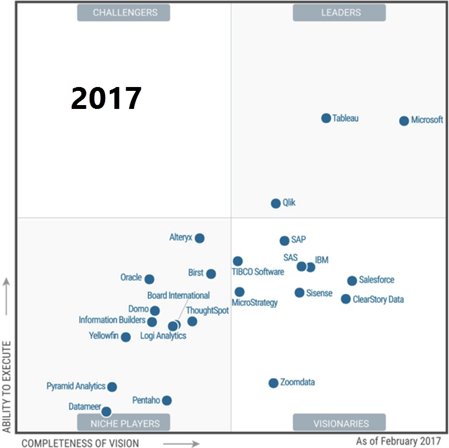
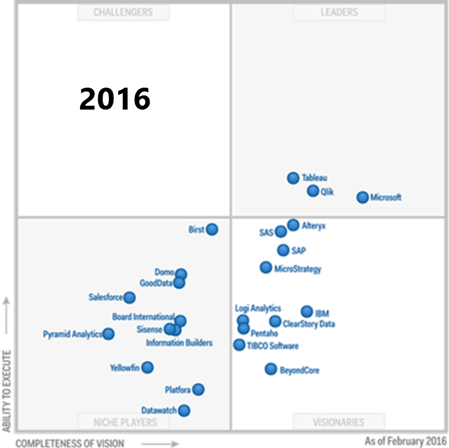
Power BI is enjoying a tremendous momentum and unprecedented popularity. Just within this month, your humble correspondent has been teaching Power BI four times in a row. It looks like industry observers are taking notice of this momentum. As Kamal Hathi (General Manager, Microsoft BI) announced, the newly released Garner Magic Quadrant for Business Intelligence and Data Analytics gave Microsoft a very high score. The image below shows the Microsoft’s lift between last year and this year in the Gartner magic quadrant.

I’m not surprised about the Qlik drop given they sold out the company. What’s still surprising to me is that Gartner ranked Tableau and Microsoft almost the same on the ability to execute. Although the report is not out yet, judging by the stub, Gartner used the same 14 criteria as last year, but added one more which is unknown at this point (probably real-time where Microsoft can score very high as well). Here are my comments on where Microsoft stands on these 14 criteria. You might also find my two-part blog about Tableau vs. Microsoft useful if you are tasked to compare vendors.

Capability

Teo’s Rank for MS BI

Comments
InfrastructureBI Platform Administration
Capabilities that enable scaling the platform, optimizing performance and ensuring high availability and disaster recovery

High

On premises or cloud, I think the MS BI Platform is second to none
Cloud BI
Platform-as-a-service and analytic-application-as-a-service capabilities for building, deploying and managing analytics and analytic applications in the cloud, based on data both in the cloud and on-premises

High

Power BI supports both pure cloud and hybrid architectures
Security and User Administration
Capabilities that enable platform security, administering users, and auditing platform access and utilization

Medium

More work is required to support external users in Power BI, Power BI Embedded, and SSRS
Data Source Connectivity
Capabilities that allow users to connect to the structured and unstructured data contained within various types of storage platforms, both on-premises and in the cloud.

High

As of this time, Power BI supports close to 70 connectors to let you connect to cloud and on-premises data sources. No scripting required.
Data ManagementGovernance and Metadata Management
Tools for enabling users to share the same systems-of-record semantic model and metadata. These should provide a robust and centralized way for administrators to search, capture, store, reuse and publish metadata objects, such as dimensions, hierarchies, measures, performance metrics/key performance indicators (KPIs) and report layout objects, parameters and so on. Administrators should have the ability to promote a business-user-defined data model to a system-of-record metadata object.

Medium

Power BI has done a good job to provide auditing and admin oversight but more work is required for proactive monitoring and improving its data governance capabilities
Self-Contained Extraction, Transformation and Loading (ETL) and Data Storage
Platform capabilities for accessing, integrating, transforming and loading data into a self-contained storage layer, with the ability to index data and manage data loads and refresh scheduling.

Medium

SSIS is the most popular on-premises ETL tool. More work is required to bring similar capabilities in the cloud (I think Azure Data Factory is a step backwards)
Self-Service Data Preparation
The drag-and-drop, user-driven data combination of different sources, and the creation of analytic models such as user-defined measures, sets, groups and hierarchies. Advanced capabilities include semantic autodiscovery, intelligent joins, intelligent profiling, hierarchy generation, data lineage and data blending on varied data sources, including multistructured data

High

Power BI Desktop and Excel has a fantastic query editor (originated from Power Query) that scores big with business users. Tableau doesn’t have such native capabilities. Power BI and Excel have best of class self-modeling capabilities (much better than Tableau). Azure Query Catalog can be used for dataset autodiscovery.
Analysis and Content CreationEmbedded Advanced Analytics
Enables users to easily access advanced analytics capabilities that are self-contained within the platform itself or available through the import and integration of externally developed models.

High

Not sure what is meant here by “advanced analytics capabilities”. Power BI supports integration with R, Azure Machine Learning, clustering, forecasting, binning, but I might be missing something.
Analytic Dashboards
The ability to create highly interactive dashboards and content, with visual exploration and embedded advanced and geospatial analytics, to be consumed by others

High

“Highly interactive dashboards and content” is what Power BI is all about.
Interactive Visual Exploration
Enables the exploration of data via the manipulation of chart images, with the color, brightness, size, shape and motion of visual objects representing aspects of the dataset being analyzed. This includes an array of visualization options that go beyond those of pie, bar and line charts, to include heat and tree maps, geographic maps, scatter plots and other special-purpose visuals. These tools enable users to analyze the data by interacting directly with a visual representation of it

High

According to Gartner’s definition, Power BI should score high but more work is required on the visualization side of things, such as ability to drill through a chart point as we can do in SSRS.
Mobile Exploration and Authoring
Enables organizations to develop and deliver content to mobile devices in a publishing and/or interactive mode, and takes advantage of mobile devices’ native capabilities, such as touchscreen, camera, location awareness and natural-language query

High

Native apps for iOS, Android and Windows to surface both Power BI and SSRS reports.
Sharing of FindingsEmbedding Analytic Content
Capabilities including a software developer’s kit with APIs and support for open standards for creating and modifying analytic content, visualizations and applications, embedding them into a business process, and/or an application or portal. These capabilities can reside outside the application (reusing the analytic infrastructure), but must be easily and seamlessly accessible from inside the application without forcing users to switch between systems. The capabilities for integrating BI and analytics with the application architecture will enable users to choose where in the business process the analytics should be embedded.

High

An Azure cloud service, Power BI Embedded allows you to do this with an appealing cost-effective licensing model.
Publishing Analytic Content
Capabilities that allow users to publish, deploy and operationalize analytic content through various output types and distribution methods, with support for content search, storytelling, scheduling and alerts.

Medium

Power BI supports subscriptions and data alerts but we can do better, such as to allow an admin to subscribe other users. “Storytelling” can mean different things but I thought the integration with Narrative Science can fall into this category.
Collaboration and Social BI
Enables users to share and discuss information, analysis, analytic content and decisions via discussion threads, chat and annotations

High

Power BI supports this with workspaces and Office 365 unified groups.

Of course, there are many competing definitions of what constitutes a BI and Analytics platform. Again, it looks to me that Gartner has predominantly focused on the self-service BI aspect of it (even there Microsoft should have scored higher) and ignored the SQL Server BI features and all the cloud BI-related products (Azure SQL Database, SQL Data Warehouse, Azure ML, Query Catalog, HDInsight, StreamInsight). If we take them in consideration, where will that dot be?

Customer Success Case – ZynBit

One of our customers, ZynBit, made the Power BI blog today! Initially, ZynBit was considering Tableau but abandoned it in favor of Power BI because of the Power BI superior data modeling capabilities and the cost effective licensing model of Power BI Embedded. Prologika helped ZynBit to transition their solution to Power BI, including designing the data model and integrating reports with Power BI Embedded. Read our case study here.

Make BI Great Again!

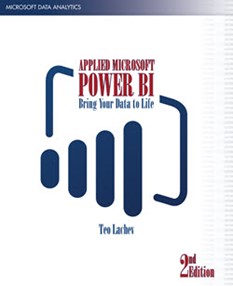
…with the second edition of my “Applied Microsoft Power BI” book. After seven books and starting from scratch every time, I finally got to write a revision! Thoroughly revised to reflect the current state of Power BI, it added more than 20% new content and probably that much content was rewritten to keep up with the ever changing world of Power BI. Because I had to draw a line somewhere, Applied Microsoft Power BI (2nd Edition) covers all features that were that were released by early January 2017 (including subscriptions). As with my previous books, I’m committed to help my readers with book-related questions and welcome all feedback on the book discussion forum on the book page. While you are there, feel free to check out the book resources (sample chapter, front matter, and more). Consider also following my blog at https://prologika.com/blog and subscribing to my newsletter at https://prologika.com to stay on the Power BI latest.

  • Buy the paper copy from Amazon
  • Buy the Kindle ebook from Amazon
  • Other popular channels in 2-3 weeks

MVP for 13 Years!

Microsoft awarded me again with the Most Valuable Professional (MVP) Award for Data Platform. This is a prestigious annual award given to selected individuals in recognition for their expertise and contribution to the community. There are 387 Data Platform MVPs worldwide and 92 of them are in the United States. his makes it 13 consecutive years for me as Data Platform MVP!

mvp_logo_horizontal_secondary_blue286_rgb_300ppi

Applied MDS and DQS Training Class Available

In my opinion, every mid-size to large organization should have a solution for master data management. Based on my observations, data quality issues have reached a pandemic level. Ironically, putting a “lipstick on the pig” with some cool visualizations appears to have a higher priority on the BI roadmap but it’s just masking the underlying issues. The focus should be on centralizing data management and improving data quality. I know this is easier said than done and the problem is further complicated by the proliferation of systems and corporate acquisitions. I know an organization which spent $8M (kid you not) on a MDM project with one of the most prominent management consulting companies and all they got back after two years was slides and documentation. It shouldn’t be this way of course. But start somewhere…. Start small, perhaps with putting under control all of these Excel spreadsheets that are floating around in your company (aka referenced data).

And you don’t have to break the bank for software. Luckily, SQL Server has a great toolset for master data management and data quality. Speaking of which, I’m happy to announce my latest training class: Applied Master Data Services and Data Quality. This two-day class is designed to help you become proficient with SQL Server 2016 Master Data Services (MDS) and Data Quality Services (DQS). IT and business users will learn how to design MDS models and extend them with business rules, attribute groups, and hierarchies. IT will learn how to integrate MDS with upstream and downstream systems and how to enforce secured access. Business users will learn how to use Excel to manage data with the tool they love most – Excel! Then, the class teaches how to create DQS knowledge bases, perform matching and cleansing tasks, and integrate DQS with MDS and SSIS. The class can be customized to target separately pro and business user audiences.