-
Tableau Prep vs. Power Query
April 26, 2018 / 18 Comments »
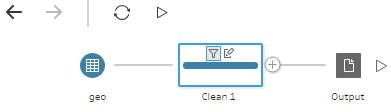
After a few years of extensive development and beta testing, Tableau announced its data preparation tool (Tableau Prep) for "redefining your data prep experience". Previously, Tableau relied on other vendors, such as Alteryx, for self-service data preparation. Naturally, I wanted to take it for a spin and compare it with the Microsoft Power Query (available for free in Power BI Desktop and Excel), which has been around since January 2013. Power Query was initially introduced as an Excel add-on but now it's available in both Excel and Power BI Desktop. For those of you pressed for time, here is the gist: Criteria Power Query Tableau Prep Price Free $70/user/month for Creator bundle Integration Integrated with Power BI and Excel Stand-alone (with preview in Tableau Desktop) Prepackaged Connectors 70 26 Custom Connectors Yes No Row-level transformations Keep rows, remove rows, remove duplicates, promote headers, group by, merge, append, pivot, transpose, combine...
-
Atlanta MS BI and Power BI Group Meeting on April 30th
April 23, 2018 / No Comments »
MS BI fans, join us for the next Atlanta MS BI and Power BI Group meeting on Monday, April 30th at 6:30 PM. Patrick LeBlanc will do a deep dive into Power BI Report Server. TEKsystems will sponsor the meeting. And your humble correspondent will demo several latest Power BI features: buttons and Q&A. For more details, visit our group page and don't forget to RSVP (use the RSVP survey on the group page) if you're planning to attend. Atlanta BI Group April 30th Meeting Reminder Please RSVP to help us plan food by 2 PM on the day of the meeting by latest: Go to the Atlanta BI home page (atlantabi.pass.org). Choose Yes and submit the RSVP survey found at the right top corner of the page. Please note that the voting system tracks votes by cookies. If you don't see the option to submit the survey, clear your browser cookies, or right-click the...
-
Processing AAS Models Asynchronously
April 22, 2018 / No Comments »
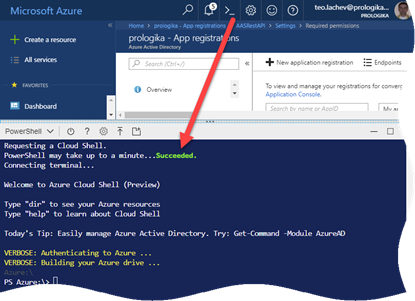
Analysis Services normally requires a live connection between the client and server. If the connection is interrupted, the server considers that the client has lost interest and cancels the running operation.Strictly speaking, there is a 'long running operations' (LRO) protocol built over the HTTP XMLA messaging protocol which mitigates the issue of disconnects by attempting to keep alive the request/responses. This helps avoid the HTTP disconnection problem for the client libraries and improve the reliability of client applications. But in the end, your mileage will vary depending on the reliability of the networks in between the client machine and the service endpoint. You don't have to worry about the connection quality when you send queries as they usually execute fast. Processing, however, is a different story as it might take very long. As a reference point, a 4 billion database can take easily half a day to refresh. Babysitting processing and hoping that...
-
Understanding AAS Synchronization
April 18, 2018 / No Comments »
None of the Multidimensional and Tabular semantic models I've implemented required scaling out, but I understand that some scenarios might benefit from it, such as B2B or B2C reporting. Depends on the implementation approach, another benefit could be implementing a highly available farm. Implementing a scaled-out, on-premises SSAS farm is not easy. There are different techniques but all of them involve a compromise between availability and latency. Azure Analysis Services sought to make this easier. It's as easy as changing a slider and AAS synchronizes everything somehow, right? Wrong. Here are the high-level notes of how AAS synchronization works: As a part of configuring synchronization, you can specify a designated processing node. If you do specify a processing node, processing takes place on that node only and the updated cache is distributed to the query nodes. If you don't specify a processing node, one of the query nodes handles both...
-
Demystifying Tabular Object Level Security (OLS)
April 15, 2018 / No Comments »
Object-level security (OLS) is a frequently requested security feature when implementing semantic models. For example, a current project disallows some sales persons to see sensitive measures, such as Margin and Profit. In Multidimensional, modelers could use cell security to meet such requirements with the risk of compromising performance. Starting with SQL Server 2017 (compatibility level 1200), Tabular supports object-level security to disallow access to entire tables or specific columns without a performance penalty. As it stands, OLS has the following limitations (for a full list, review the documentation): There is no user interface for defining OLS. Instead, after defining your roles and row filters as you'd typically do, you need the extra step to open the model.bim source code and enter the OLS definition manually. For example, this Users role definition disallows access to the GrossProfit column. Fortunately, SSDT preserves OLS when you make changes to the role in the Role...
-
Another Successful Power BI Workshop
April 13, 2018 / No Comments »
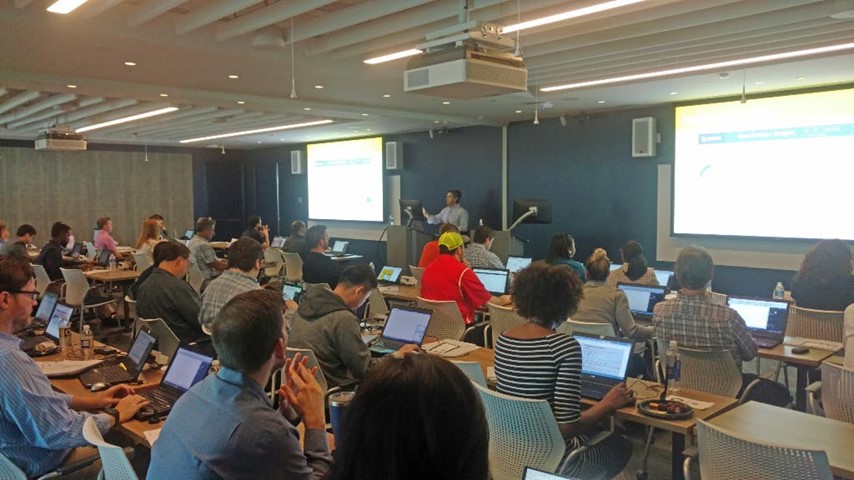
Thank you to everyone attending the Power BI workshop by Prologika yesterday. We had great turnout with more than 50 people from 30 companies attending the event at the Microsoft Technology Center in Alpharetta! The key takeaways were: Many companies transition to Power BI because of its great value-to-cost proposition. PowerQuery is a fantastic tool for data cleansing and transformation that is missing in other competitor offerings. Power BI can deliver rich visualization capabilities that delight end users and surpass by far the capabilities of traditional reporting tools. Instead of being a just a stand-alone BI tool, Power BI is a part of a rich ecosystem of products and services that allows you to extend Power BI in versatile ways.
-
Notes on Analysis Services Tabular Performance and Parallelism (Part 2)
April 9, 2018 / No Comments »
In my "Notes on Analysis Services Performance and Parallelism" blog, I shared limited performance results about scaling up Azure Analysis Services Tabular. As I mentioned, I expect the same findings to apply to SQL Server Analysis Services Tabular for on-premises deployments. As the official load test results came in, I'm ready to provide more info and general recommendations. We load tested the AAS semantic model mentioned in the previous blog (about 2 billion rows) by capturing a representative subset of DAX queries including slow, medium and fast queries. We used a stepped load starting with one user and increased the number of concurrent users with one every 30 seconds. We considered the server saturated when 90% of maximum QPU was reached on average. For example, the S4 performance level has 400 QPU (20 cores) so the saturation level would be 360 QPU on average. Note It takes a while for the Azure...
-
Notes on Analysis Services Performance and Parallelism
April 4, 2018 / 1 Comment »
As a part of a semantic model assessment, I got to experiment with different configurations of Azure Analysis Services. In this case, the largest fact table has almost 2 billion rows so it's a good size model. I was particularly interested the correlation between a higher performance tier and query performance. One thing that I like about PaaS is that it's easy to change and experiment with different configurations. The thing that I don't like is that I can't peek under the hood. This is probably done on purpose to keep people like me out, just like these green nets surrounding construction zones. So, I don't know what hardware AAS is running on and how it's configured. And I failed to get clarification from Microsoft. So, I might be out of line here, but I thought my findings are worth sharing albeit not officially vetted. AAS Basic and Standard tiers...
-
Power BI Models Scaling Up
March 21, 2018 / 6 Comments »
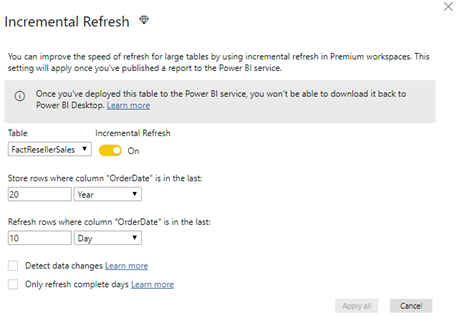
Chris Webb wrote a great post today "Power BI Roadmap Announcements In the Dynamics 365 Spring '18 Release Notes" citing the many exciting new features coming to Power BI in the next few months and highlighting the huge momentum behind Power BI. I want to bring your attention to a couple of them: Incremental data refresh: Organizations can use incremental data refresh to scale datasets to even larger sizes. With incremental data refresh, users can load only new or changed data. When creating a dataset in the Power BI Desktop, a user configures a refresh table for each table in the model that is to load incrementally, and then publishes it to a Power BI Premium workspace. Thereafter, each scheduled refresh loads only new or changed data. Query acceleration for large datasets (Public Preview): Users can create DirectQuery models over any size data in sources, such as Spark and Azure...
-
Atlanta MS BI and Power BI Group Meeting on March 26th
March 21, 2018 / No Comments »
MS BI fans, join us for the next Atlanta MS BI and Power BI Group meeting on Monday, March 26th at 6:30 PM. Leo Furlong will introduce you to implementing organizational semantic models with Azure Analysis Services. BlueGranite will sponsor the meeting. And your humble correspondent will demo several latest Power BI features: persistent filters, tooltip pages, and share to anyone. For more details, visit our group page and don't forget to RSVP (use the RSVP survey on the group page) if you're planning to attend. Presentation: Introduction to Azure Analysis Services Date: March 26, 2018 Time 6:30 – 8:30 PM ET Place: South Terraces Building (Auditorium Room) 115 Perimeter Center Place Atlanta, GA 30346 Overview: Azure Analysis Services (AAS) is an exciting tool within the Azure Data Services tool set. In this session, we’ll learn about the basics of AAS including how to create the service in the Azure portal, options for developing solutions and...

We offer onsite and online Business Intelligence classes! Contact us about in-person training for groups of five or more students.