-
DAX Rank Over Two Columns
March 6, 2018 / No Comments »
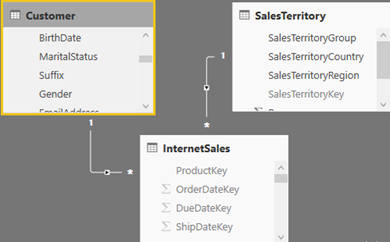
Scenario: An interesting scenario came today from a client. Consider the following schema. You have a fact table InternetSales and two dimension tables (Customer and SalesTerritory). You want to produce a report ranking each customer based on their sales for each territory. In addition, you want the rank to change as you filter the report, such as filter specific customers or specific territories, so you need a measure. Solution: The DAX RANKX function takes a table as the first argument. However, in this case, the rank needs to be produced over fields from two tables. So, the CROSSJOIN function is used to produce the needed combination. 'InternetSales'[CustomerRank] := IF ( ISBLANK([SalesAmount]) || NOT HASONEVALUE(Customer[FullName]), BLANK(), RANKX(CROSSJOIN(ALLSELECTED('Customer'[FullName]), ALLSELECTED('SalesTerritory'[SalesTerritoryCountry])), [SalesAmount],,,DENSE) ) The ALLSELECTED function is needed to ignore the context from the FullName and SalesTerritoryCountry from the respective columns on the report. The condition in the IF statement ignores calculating the rank for customers...
-
Prologika AppSource Consulting Offers
February 28, 2018 / No Comments »
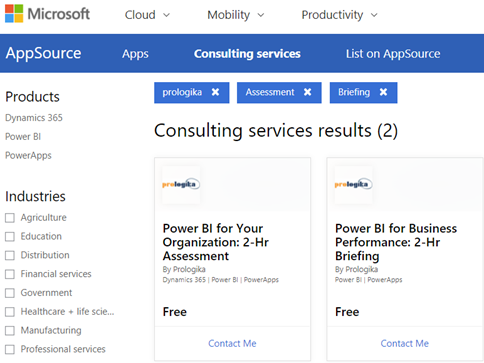
Microsoft selected and published two Prologika Power BI-related consulting offers on Microsoft AppSource. And their price is right; they are both free! Power BI for Your Organization: 2 HR Assessment – Prologika will evaluate your data analytics objectives to determine how Power BI can empower your organization to understand better and improve its business. Power BI for Business Performance: 2-Hr Briefing – Prologika will provide you with a free, 2-hour briefing on how our client derived tremendous value from our solution for Business Performance Management. Learn how Prologika transformed the way a large organization does financial planning by creating and comparing budgets and forecasts with our customized solution based on the Microsoft Data Platform and Power BI.
-
2018 Gartner Magic Quadrant for Analytics and BI Platforms
February 27, 2018 / No Comments »
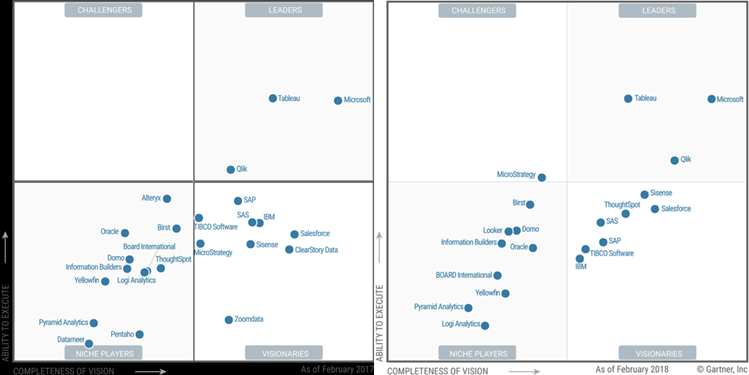
The 2018 Gartner Magic Quadrant for Analytics and Business Intelligence Platforms is out. I read the report and followed the dots. I personally hoped to see the Microsoft dot higher than the overrated Tableau, given everything I said here, here, and here. I'm glad that Gartner finally realized what I have been saying all along that Tableau lacks "complex data model support" among many other things. Anyway, this is a great endorsement of how far Power BI has come. And about what Microsoft can do when product groups work together. Mind you, the main focus of the Gartner's evaluation was Power BI. The organizational BI pieces (SQL Server, SSRS, SSAS, SSIS, Azure) were not considered. Here are my thoughts about the Microsoft-related cautions cited by Gartner: Mode 2 analytics, Azure cloud only – "Power BI has mainly focused on the requirements for Mode 2 (agile, self-service) analytics, while its on-premises SQL Server Reporting Services serves the needs...
-
Quadrants Here, Quadrants There…
February 26, 2018 / No Comments »
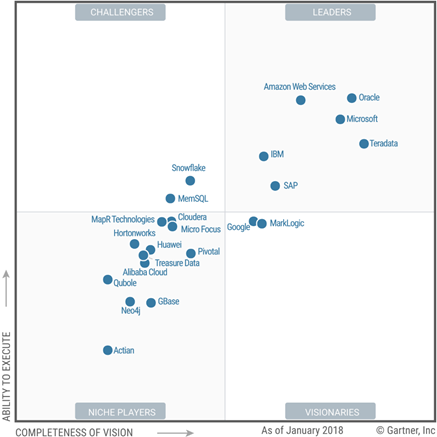
While we're waiting for the Gartner 2018 Magic Quadrant for Data Analytics (should be out any moment), two others related to data analytics were released. 2018 Magic Quadrant for Data Management Solutions for Analytics This one evaluates "complete software system that supports and manages data in one or more file management systems (usually databases)". So, think of traditional and cloud-based data warehousing. I'm surprised to see AWS ahead of Microsoft and Oracle in the ability to execute, given that Amazon doesn't have on-premises offerings (see the ML quadrant below where apparently that's important). 2018 Magic Quadrant for Data Science and Machine-Learning Platforms This one evaluates "vendors of data science and machine-learning platforms. These are software products that data scientists use to help them develop and deploy their own data science and machine-learning solutions." I personally don't agree with Gartner on the Microsoft Visionary rank, given all the investments Microsoft has...
-
Unblocking MDX Queries from SSRS Reports
February 23, 2018 / No Comments »
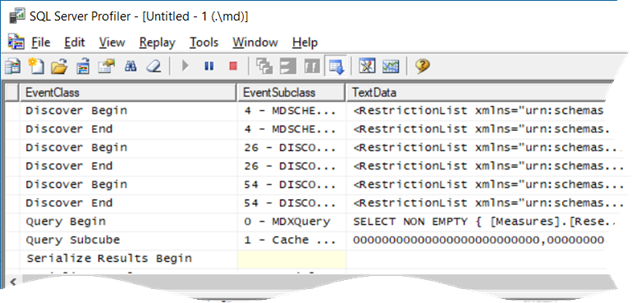
I love performance optimization. It's exciting to peek under the hood and take a deep dive in the mysterious world of how Microsoft designed things. And it always humbles me by bringing forth gaps in my knowledge. Scenario: You have SSRS reports that query Analysis Services Multidimensional cubes. When users request reports in Report Manager (aka Web Portal starting with SSRS 2016) and … the report hangs sporadically, without even getting to the ReportViewer page… for minutes. The server doesn't appear to be under resource pressure. The issue happens when the cube is being processed. And no, this is not about locking. Solution: This one wasn't trivial to figure out. The profiler showed that when the report is requested, SSRS fires the first MDX query (typically, a query that populates the parameter available values). The breakthrough came when I executed the same query in SSMS while the SSRS one was...
-
Atlanta MS BI and Power BI Group Meeting on February 26th
February 22, 2018 / No Comments »

MS BI fans, join us for the next Atlanta MS BI and Power BI Group meeting on February 26th at 6:30 PM. Stacey Jones will explain how Power BI can integrate with other systems, such as Dynamics and Salesforce. SentryOne will sponsor the meeting. And your humble correspondent will show you two latest Power BI features: report sharing and date tables. For more details, visit our group page and don't forget to RSVP (use the RSVP survey on the group page) if you're planning to attend. Presentation: Integrating Power BI with Dynamics and Other Solutions Level: Intermediate Date: February 26, 2018 Time 6:30 – 8:30 PM ET Place: South Terraces Building (Auditorium Room) 115 Perimeter Center Place Atlanta, GA 30346 Overview: Microsoft has differentiated itself for many years as the company that not only sells software, but software that works well together. For example, many companies sold suites of office productivity software, but none sold...
-
Tableau Hyper vs. Power BI xVelocity
February 18, 2018 / 6 Comments »

To compete more effectively with Power BI, Tableau acquired a database technology called HyPer. Like the Microsoft xVelocity in-memory technology (formerly known as VertiPaq), which powers Analysis Services Tabular, Power BI, and SQL Server Columnstore, HyPer is an in-memory database system. Hyper was initially developed as a research project at the Technical University of Munich. Tableau explains that "with Hyper, transactions and analytical queries are processed on the same column store, with no post-processing needed after data ingestion. This reduces stale data and minimizes the connection gap between specialized systems. Hyper's unique approach allows a true combination of read-and write-heavy workloads in a single system. This means you can have fast extract creation without sacrificing fast query performance. (We call that a win-win.)". Tableau shipped Hyper with Tableau v10.5. Here, we have a statement that Tableau claimed that Hyper achieved 3x faster data extraction and 5x increase in query performance...
-
Overwriting Power BI Filters
February 14, 2018 / No Comments »
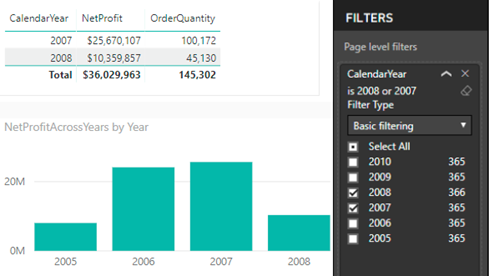
Scenario: You've created a dashboard-looking Power BI report that has a filter. Most visuals on a report page need to show only data for the selected filter but some must ignore the filter. Solution: There are several solutions to achieve this goal depending on requirements. Let's start with the no-brainer and move down in complexity. Move the unfiltered visuals to another report page -- Slicers and page-level filters filter visuals on the same page (note that the Power BI Desktop February update allows you to configure a report-level slicer). By moving the visuals that should remain unaffected by the slicer to another page, you're effectively ignoring the page-level filtering. Use a slicer and "Edit Interactions" – If you use a slicer, you can use the Edit Interactions feature (Format ribbon) to specify which visuals ignore the slicer selection. Edit Interactions is described in more detail here. Consider using time calculations –...
-
PASS Summit 2018 Registration
February 10, 2018 / No Comments »

Planning to attend the PASS Summit this year? The PASS Summit is the go-to conference for data professionals that will take place November 6-9, in Seattle, WA. You have two options to register: Early bird registration priced at $1,699 has started and it will continue until March 23, 2018. As a bonus, use code LGSTRMZB8 at registration to get streaming access to all PASS Summit 2017 content! Pay the regular price after March 23, 2018.
-
Visual-level Formatting in Power BI
February 7, 2018 / No Comments »
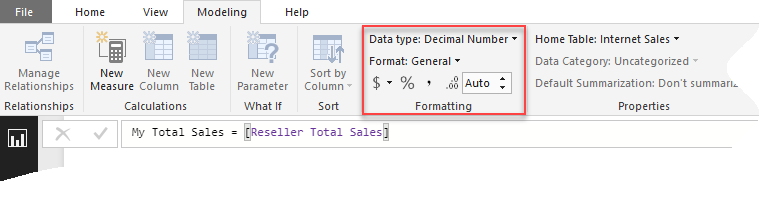
Scenario: You want to overwrite the formatting of some field in a Power BI Visual, such as in the case of showing the field in one visual with decimals and then in another without decimals. Or, you might want to overwrite the default format when connected live to a semantic model. You search left and right, bing the Internet, and still no clue as to why Power BI doesn't have this feature. Answer (that you probably won't like): Most visuals already support display units and decimals. Table and matrix would probably get this feature very soon. We don't have ETA for full custom format string override (per visual). Your vote counts so vote on ideas.powerbi.com. As a best practice, I recommend applying format settings in the model so that it's applied consistently to all reports. In the narrower case of formatting measures, you can create a new measure and change its...
Training
 We offer onsite and online Business Intelligence classes! Contact us about in-person training for groups of five or more students.
For more information or to register click here!
Books
 Learn Power BI at your own pace with our latest book Applied Microsoft Power BI. Targeting information workers, data analysts, pros, and developers, It is designed as an easy-to-follow guide for learning how to implement BI solutions spanning the entire personal-team-organizational BI spectrum.

