-
2-Day Applied Power BI Workshop – Atlanta
August 8, 2016 / No Comments »
Are you looking for an agile self-service platform that doesn't require reporting and query skills to get basic analytics done without reliance on IT? Or, perhaps you've heard or evaluating Power BI but not sure where to start or how to take the most out of it? If so, this workshop is for you. A year ago Microsoft unveiled the new Power BI platform consisting of the PowerBI.com cloud service, Power BI Desktop, and Power BI Mobile. Since then, Prologika has helped organizations of all sizes to adopt Power BI. Packed with features, Power BI supports a dizzying variety of features and integration scenarios and it offers plenty to all types of users interested in data analytics: information workers, data analysts, BI pros, and developers. Reserve your seat today to attend this insightful 2-day workshop for only $999 (use coupon POWERBI20160914 to get 10% discount when signing up two or more people) at the Microsoft Office in Alpharetta, when Teo Lachev (CEO of...
-
Formulating a Power BI Enterprise Strategy Seminar – Atlanta
August 8, 2016 / No Comments »
A year ago Microsoft unveiled the new Power BI platform consisting of the PowerBI.com cloud service, Power BI Desktop, and Power BI Mobile. Since then, Prologika has helped organizations of all sizes to plan and adopt Power BI. Packed with features, Power BI supports a dizzying variety of features and integration scenarios but it might be difficult to understand how Power BI fits in your data analytics ecosystem. Join Prologika and Microsoft for a 3-hour free seminar on Wednesday, August 31th, 8:30 AM -12 PM ET, at the Microsoft Office in Alpharetta, when Teo Lachev (CEO of Prologika) and Brian Jackson (Cloud Solution Architect at Microsoft) share practical knowledge and experience to help you to formulate a Power BI enterprise strategy. If you're considering Power BI but you're not sure how it fits within your organizational data strategy, this event is for you. Key Takeaways Understand how Power BI changed the way users (information workers, data analysts, BI...
-
Going with the Flow
August 1, 2016 / No Comments »
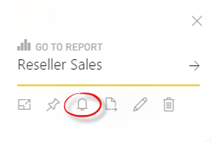
Currently in preview, Microsoft Flow is a cloud service for creating automation flows without writing code, similar to Zapier's "zaps" and IFTTT's "recipes". How is this useful for BI? Let's consider an example. Power BI has recently introduced data-driven alerts in Power BI Service (previously alerts were supported on iPhone only). Currently, alerts can be created only on single-card and gauge dashboard tiles that are connected to imported datasets. You can go to the tile properties and click the Manage Alerts (bell) icon to create an alert rule, such as "SalesAmount is above 1,000,000." When the alert rule condition is met, you are notified in the Power BI notification center and by e-mail. But what if you want to broadcast the alert to a large audience? Currently, this feature is not a Power BI native feature. Sure, you can forward the email manually but what if you're on vacation or the alert...
-
Trend Lines in Power BI Charts
July 28, 2016 / No Comments »
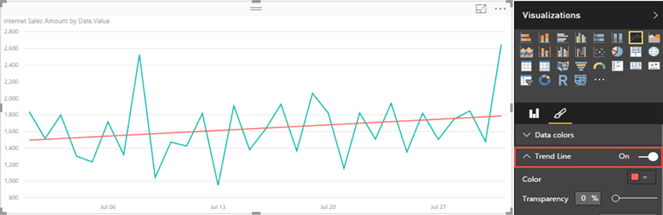
Recently, Power BI charts introduced trend lines. However, they require numeric or date values on X-axis, which must have a continuous type. In fact, if you use a text field for the X-axis, a warning indicator will be displayed in the top left corner of the chart to warn you that non-numeric values are used. This requirement presents issues if the report is connected to a Multidimensional cube because by default all attributes are text-based. As a workaround, in the Multidimensional project set the ValueColumn property of the attribute to a column in the underlying table of a numeric or date data type, and deploy the cube. Back to Power BI Desktop, bind the corresponding .Value field to the X-axis.
-
Happy Birthday, Power BI!
July 24, 2016 / No Comments »
Power BI is one-year old. it's hard to imagine that one year has passed but here we are. The momentum behind Power BI is huge both from development and customer perspectives. It's exiting to see a product that evolves so fast based on feedback from users. So, there will be many more birthdays. And for the nay sayers out there, no, Power BI is not immature as its building blocks (Power Pivot, Power Query, Power View, Tabular, Azure) have been around for many years. Anyway, it's time to recognize all the effort that went behind the new Power BI. Happy Birthday from the community! [embed]https://youtu.be/An_8wf4RwBw[/embed]
-
Atlanta MS BI Group Meeting on July 25th
July 24, 2016 / No Comments »
MS BI fans, join me for the next Atlanta MS BI and Power BI Group meeting on July 25th at 6:30 PM. Shabnam Watson will teach you MDX fundamentals. Pyramid Analytics, our sponsor, will show us why they are Microsoft Power BI preferred vendor. And I'll demo the Power BI Publisher for Excel. Rate this meeting http://aka.ms/PUGSurvey, PUG ID: 104 Presentation: A SQL Developer’s Guide to MDX Basics Level: Intermediate Date: Monday, July 25th, 2016 Time 6:30 – 8:30 PM ET Place: South Terraces Building (Auditorium Room) 115 Perimeter Center Place Atlanta, GA 30346 Overview: MDX is an industry standard query language for OLAP systems and is used to query Microsoft Analysis Services (SSAS). Custom MDX queries can be authored in SQL Server Management Studio (SSMS), Reporting Services, Power BI and custom applications. While SQL and MDX share some common keywords, they have very different syntax and concepts. This session is for anyone...
-
Is Your BI Strategy Cost Effective?
July 24, 2016 / No Comments »
Have you looked at your BI spend recently? Sometimes, I'm puzzled by the enormous spending in "this is how we've always done it" initiatives that probably could be replaced and done much more efficiently with modern technology and cloud computing. I had a recent conversation with a Chief Analytical Officer of one of the US largest financial organizations. They have outsourced hosting of their 5 TB data warehouse to another company that charge them more than 100K per month. And this is just for hosting on a single SMP SQL Server with no fault tolerance and SLA in place! Was he surprised to find that this data warehouse could be hosted in SQL Server Data Warehouse on Azure for well under 10K per month? Not to mention that besides x10 cost savings, they'll get a Massive Parallel Processing (MPP) system on a par with Teradata and Netezza, with the ability...
-
Presenting for Steel City SQL User Group, Birmingham
July 18, 2016 / No Comments »
I'm presenting in person "What's New for BI in SQL Server 2016" for the SQL User Group in Birmingham, AL tomorrow, July 19th starting at 6 PM local time. Steel City SQL July 2016 Meeting Language: English Event Type: In-Person Online Meeting URL: None RSVP URL: https://steelcitysqljul2016.eventbrite.com Join us Tuesday the 19th in Room 311 of Russell Hall on the Samford University campus for the July meeting of Steel City SQL. This meeting will feature MVP Teo Lachev presenting What's New for BI in SQL Server 2016. Food and beverages for this month's meeting will be provided. If you plan on attending this month's meeting let us know by registering at steelcitysqljul2016.eventbrite.com so we can plan accordingly. Hope to see you there. When iCal UTC : Tue, Jul 19 2016 23:00 - 00:30 Event Time : Tue, Jul 19 2016 18:00 - 19:30 Central Daylight Time Where 311 Russell Hall - Samford University Birmingham, Alabama What's New for BI in SQL Server 2016...
-
Aggregates over Aggregates in DAX
July 15, 2016 / No Comments »
Sometimes, you might run into a scenario that requires an aggregate over an aggregate. Consider the following report: The AvgOrderAmount has a simple calculation: SUM(Sales)/SUM(Qty). This calculation is applied uniformly. The Total line would divide 300/7 and will return 42.86. However, what is the user wants the result in the DesiredAvgOrderAmt column which produces a simple average over the details (50+40)/2. This could be accomplished by creating a base measure for the detail calculation: DesiredAvgOrderAmtBase := DIVIDE ( SUM ( [Sales] ), SUM ( [Qty] ) ) Then, the DesiredAvgOrderAmt formula would be: DesiredAvgOrderAmt := IF ( HASONEFILTER ( Customer[Customer] ), [DesiredAvgOrderAmtBase], AVERAGEX ( VALUES ( Customer[Customer] ), [DesiredAvgOrderAmtBase] ) ) HASONEVALUE would return TRUE when the calculation is performed at the detail level and FALSE in the "grand totals". In the latter case, it performs a simple average over the detail aggregates. Think of it as performing a second pass over the details to produce an aggregate over aggregates.
-
Upgrading Power BI Desktop Models to Tabular
July 10, 2016 / 2 Comments »
One great feature of Microsoft BI has been the continuum from personal BI to organizational BI. For example, a business user can start small with an Excel Power Pivot model which IT can restore at some point to a scalable Tabular model. In fact, if you know Microsoft personal BI (Power Pivot or Power BI Desktop), you already know 80% (or even more) of SSAS Tabular. Unfortunately, currently there isn't a supported way to restore Power BI Desktop models to Tabular or create a Tabular project from a pbix file. The reason is that because Power BI Desktop is changing on a monthly basis, it's ahead of Tabular and currently Power BI Desktop doesn't support backward compatibility. However, the following approach worked for me to upgrade Power BI Desktop to Tabular 2016. Power BI Desktop has a Tabular child process which is the workhorse for all data crunching you do...

We offer onsite and online Business Intelligence classes! Contact us about in-person training for groups of five or more students.