-
Starting SSIS 2012 Job Remotely
April 18, 2014 / No Comments »
Scenario: Inspired by the new SSIS 2012 capabilities, you've managed to convince management to install SSIS 2012 on a new server for new ETL development. But your existing ETL is still on SQL Server 2008 (or R2) and there is no budget for migration and retesting. You want to start SSIS 2012 jobs from the 2008 server, e.g. in SQL Server Agent on completion of a certain SSIS 2008 job. Solution: Courtesy to Greg Galloway for clueing me on this, thanks to its CLR integration, SSIS 2012 supports initiating jobs via stored procedure in the SSIS catalog. Although the process could benefit from simplification, it's easy to automate it, such as (you guessed it) with an SSIS 2008 calling package. It goes like this: Call catalog.create_execution in the SSISDB database to create an execution for the SSIS job. At this point, the job is not started. It's simply registered with...
-
How to Cluster Analysis Services
April 17, 2014 / No Comments »
Some scenarios require a fault-tolerant SSAS installation. In a real-life project, an active-active cluster met this requirement. Instead of installing an active-passive cluster where one node just plays a sitting duck waiting for the active node to fail, with the active-active cluster we had two active nodes to distribute processing and achieve high availability. The first node had the SQL Server database engine hosting the data warehouse database while the second had SSAS. If one of the nodes would fail, its services will fail over to the other. Configuring a failover cluster requires many steps. Luckily, Microsoft just published a whitepaper "How to Cluster SQL Server Analysis Services" by Allan Hirt (SQL Server MVP) that includes step-by-step instructions of how to configure SSAS (Multidimensional or Tabular) on a Windows Server failover cluster (WSFC). Although not discussed, instead of WSFC, yet another way to achieve high tolerance that gains popularity is...
-
BISM Drillthrough Capabilities
April 16, 2014 / No Comments »
All the three BISM flavors (Multidimensional, Tabular, and Power Pivot) supports default drillthrough to allow the end user to see the level of details behind an aggregated measure by just double-clicking the cell. However, the implementation details differ. Multidimensional supports default drillthrough on regular measures only, that is, measures that bind to columns in fact tables. Multidimensional doesn't support drillthrough on calculated measures, even if these measures are simple tuples, such as ([Measures].[Sales Amount], [Product].[Product Category].[Some Category]). On the other hand, Power Pivot and Tabular don't have the concept of regular measures and they support only calculated measures. Even if the user drags a column to the Values zone on a pivot or Power View report, the tool creates an implicit measure with a DAX formula behind the scenes, such as =SUM(ResellerSales[Sales Amount]). Because of this, Power Pivot and Tabular appears to allow drillthrough on any measure. However, the drillthough...
-
The Power Pivot Update Story
April 14, 2014 / No Comments »
The Power Pivot update story is somewhat convoluted. Excel 2013 integrates Power Pivot natively and the only way to get it updated (assuming the traditional MSI installation option) is through Office updates because the Office team now owns its distribution. Alternatively, if you have an Office 365 subscription, and have installed Office 2013 via the click-to-run option, then the Office and Power Pivot updates will be pushed to you automatically. With Excel 2010, Power Pivot is an external add-in that can be updated from the Microsoft download center. While the Excel 2013 Power Pivot bits are installed in the %Program Files%\Microsoft Office\Office15\ADDINS\PowerPivot Excel Add-in, the Excel 2010 Power Pivot add-in is installed in a different location: %Program Files%\Microsoft Analysis Services\AS Excel Client\110. The interesting side effect is that the Excel 2010 Power Pivot can be updated more frequently (for example, every time there is a SQL Server 2012 service pack...
-
5 Tools for Understanding BISM Storage
April 14, 2014 / No Comments »
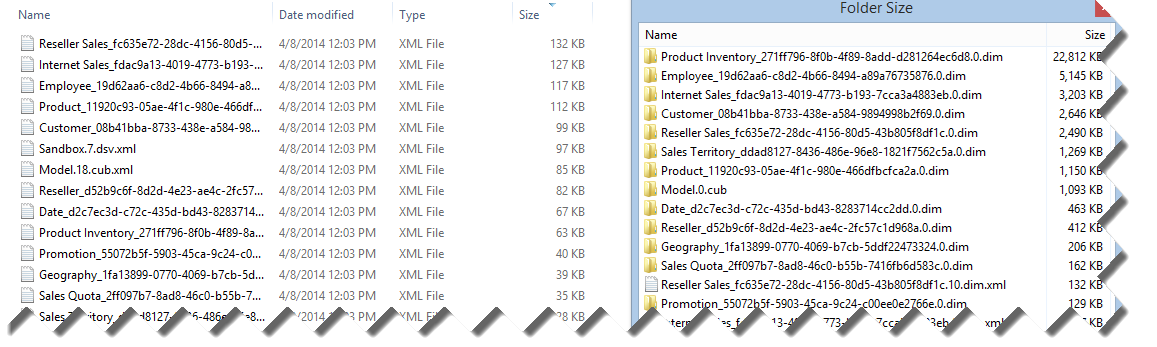
Recall that the Microsoft BI Semantic Model consists of three flavors: Multidimensional, Tabular, and Power Pivot. The default storage mode of Tabular and Power Pivot is the xVelocity in-memory engine. The default Multidimensional storage is MOLAP. You might want to analyze which objects consume the most storage space. This especially important for Tabular since computer memory is still a scarce resource. Windows Explorer The easiest way to get the storage breakdown for Multidimensional and Tabular is to use Windows Explorer and examine the size of the corresponding data folder under the SSAS Data folder, e.g. C:\Program Files\Microsoft SQL Server\MSAS11.TABULAR\OLAP\Data\AdventureWorks Tabular Model SQL 2012.0.db. Unfortunately, Windows Explorer in Windows 7 and 8 doesn't show the folder size requiring you either to hover on the folder to see its size or to go the folder properties. As a workaround, consider utilities such as HDGraph or Folder Size. Folder Size, for example, pops...
-
Where is Your Focus?
April 6, 2014 / No Comments »
With all the tremendous interest around BI, new vendors and tools are emerging almost every day. In general, you can approach your BI needs in two ways. You can try a top-down approach starting with the presentation layer, hoping that a cool data visualization tool and self-service BI will somehow solve your challenges. Lots of vendors out there would love to take you on that path. You can follow a bottom-up approach that starts with a solid data foundation and semantic layer that enables a single version of the truth and it is supported by most popular visualization tools. I had the pleasure to teach a class this week for the HR department of one of the largest and most successful companies. They have an ambitious goal to establish a modern data analytics platform in order to gain insights into all aspects of their workforce. Their manager told that they...
-
Data Models for Self-Service BI
March 30, 2014 / No Comments »
The self-service BI journey starts with the business user importing data. With Microsoft Power Pivot, we encourage the user to import tables and create relationships among these tables, similar to what they would do with Microsoft Access. This brings tremendous flexibility because it allows the user to incrementally add new datasets and implement sophisticated models for consolidated reporting, such as for analyzing reseller and internet sales side by side. True, Power Pivot relationships have limitations, including: The lookup table must have a primary key and the relationship must be established using this key. As it stands, Power Pivot doesn't support multi-grain relationship where the fact table joins the lookup table at a higher grain than the primary key. Many-to-many relationships (such as a joint bank account) are not natively supported and currently require simple DAX formulas to resolve the relationship, such as CALCULATE ( SUM ( Table[Column] ), BridgeTable) Closed...
-
Building a Custom ETL Framework with SSIS 2012
March 24, 2014 / No Comments »
Even though the SSIS catalog and the new project deployment mode in SQL Server 2012 take care of many of the mundane monitoring needs, a custom ETL framework is still important for handling features such as restartability and parallelism. Join our next Atlanta BI User Group meeting on Monday, March 31st when Aneel Ismaily will talk about this subject in his "Building a Custom ETL Framework with SSIS 2012" presentation. "ETL Frameworks are the foundation of any data warehouse/data mart implementation. In this session we will discuss building a heavy-duty enterprise ETL Framework and will talk in detail about some major ETL enhancements available in SQL Server 2012. Topics include auditing, logging, designing for fault tolerance and recoverability, handling orchestration, parallelism and finally scheduling." X-IO will sponsor the meeting and present their Intelligent Storage Element fast storage product.
-
Dynamic Dimensions
March 23, 2014 / No Comments »
Scenario You need to assign a dimension dynamically to a cube measure group, such as to calculate binning. In the extreme example, you might need to perform fact row level evaluation to determine where the dimension "fits" in. Consider the following example from the insurance industry. An ODS-style Claim table interprets every change to the claim table as a Type 2 change by creating a new row and expiring the previous row of the claim. Claim_Key Start_Date End_Date Claim_Number Status 1 1/1/2010 5/1/2010 C00001 New 2 5/2/2010 3/8/2012 C00001 Open 3 3/9/2012 12/31/9999 C00001 Closed Options Given this scenario, you might want to count the number of claims as of any date. You have two options: Create a Claim Snapshot fact table taken at a daily or monthly interval. Dynamically associate the Date dimension. In Multidimensional, this will require creating a Claim dimension and a Claim measure group, both...
-
KPIs on Smartphone
March 2, 2014 / No Comments »
Some of your might be familiar with the PushBI mobile BI offering of Extended Results. The company was recently acquired by Tibco. Now rebranded as Tibco Spotfire Metrics, its mobile BI offering is now available for the most popular mobile platforms, including Windows Phone and Windows 8. As its documentation explains, Spotfire Metrics supports surfacing KPIs from a variety of data sources, including Analysis Services. If you're looking for ways to present KPIs to mobile phones, Spotfire Metrics could fill in the gap.

We offer onsite and online Business Intelligence classes! Contact us about in-person training for groups of five or more students.