-
Investigating Deadlocks
September 8, 2014 / No Comments »
Two different customers having deadlock issues. The first one is having deadlock issues happening during DML operations in an OLTP database. The second one – during ETL load of a data warehouse. First, what is a deadlock? Imagine that a friend and you go to a supermarket to buy beer and chips. You both go to the same aisle and you both attempt to pick the same pack of beer and the same bag of cheeps (in reality, two rows might be located in the same page so the locks might be more coarse). While you pick the pack of beer and reach out for the chips, your friend has already picked the same bag of chips and he's reaching for your pack of beer. Neither of you want to let go. So, a deadlock is caused by two transactions attempting to lock two resources in the reverse order. SQL...
-
Atlanta MS BI Group Meeting on Aug 25th
August 25, 2014 / No Comments »
Join us tonight for a knowledge-packed meeting of Atlanta MS BI Group to learn how to optimize and automate your ETL. Presentation: Making your SSIS Fly Beyond the Sky Level: Intermediate to Advanced Date: Monday, August 25th, 2014 Time 6:30 – 8:30 PM ET Place: South Terraces Building (Auditorium Room) 115 Perimeter Center Place Atlanta, GA 30346 Overview: How fast can an ETL package be? How big of a dataset is too big causing us to wait several hours to load data? Do you know those properties that you never touched because you were afraid to break something else? Well, let's try them. In this demo-rich presentation, we'll focus on some 101 tips that will maximize your package throughput. We will also go deeper toward a 200-300 level, when we will walk through some very interesting database design patterns that will ultimately affect the performance of your SSIS. Speaker:...
-
Where is SSDT?
August 21, 2014 / No Comments »
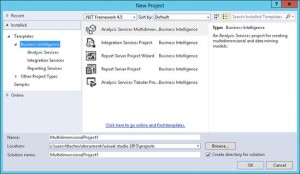
Now that Microsoft has decoupled SQL Server Data Tools from the SQL Server 2014 setup, the quest to find SSDT has started. You can download SSDT from the Microsoft SQL Server Data Tools page. Note that to get the BI project templates, you need the SSDT-BI install depending on the Visual Studio version you have (scroll all the way down the page to see the SSDT-BI links). If you don't have Visual Studio installed (you probably don't need it if you don't code), I suggest you pick the latest, which as of this writing is Download SSDT-BI for Visual Studio 2013. To make things a bit more interesting, Microsoft threw in another gotcha. When you run the SSDT setup, it will ask you if you want to install a new instance of SQL Server or add features to the existing instance. If you have SQL Server already installed, you might opt...
-
SSRS Style Templates
August 18, 2014 / No Comments »
As you probably know, the SSRS Report Wizard allows users to select predefined report styles. These styles are basic "skins" that apply to report foreground and background colors. A question came in from a student as to how to modify/add styles. You can alter the existing style templates or add new ones by editing the StyleTemplates.xml file in the \Program Files (x86)\Microsoft Visual Studio 10.0\Common7\IDE\PrivateAssemblies\Business Intelligence Wizards\Reports\Styles\<language> folder. You need to make this change on the client machine where SSDT is installed. On the subject of styles, recall that starting with SQL Server 2008 R2, SSRS supports report parts to promote report reuse and reduce maintenance.
-
Absolute Tabular KPIs
August 14, 2014 / No Comments »
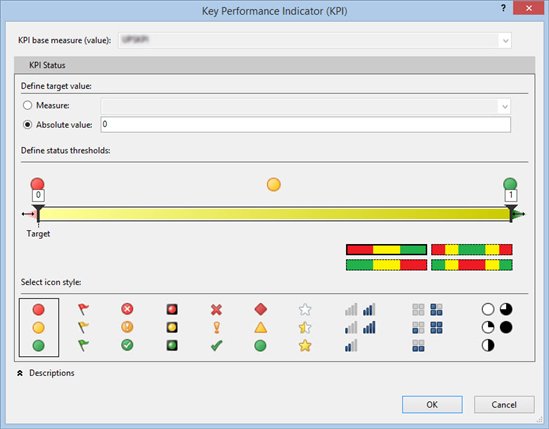
An interesting requirement popped up during an Analysis Services class I'm teaching this week. The customer wants to implement a Tabular/PowerPivot KPI that has this pseudo logic: CASE WHEN Actual Below Goal && Below LastYearSales Then Red WHEN Actual Below Goal && Above LastYearSales Then Yellow WHEN Actual >= Goal Then Green END Although I'm using Tabular, the same calculations will work with Power Pivot. Define a LastYearSales measure using the following formula assuming that the measure for the actual amount will be ResellerSales[SalesAmount] =CALCULATE(SUM(ResellerSales[SalesAmount]), PREVIOUSYEAR('Date'[Date])) Define a measure for the KPI actual value using the formula: =SWITCH(TRUE(), SUM(ResellerSales[SalesAmount])<Sum(SalesQuotas[SalesAmountQuota]) && SUM(ResellerSales[SalesAmount])<[LastYearSales],-1, SUM(ResellerSales[SalesAmount])<Sum(SalesQuotas[SalesAmountQuota]) && SUM(ResellerSales[SalesAmount])>[LastYearSales],0, SUM(ResellerSales[SalesAmount])>=Sum(SalesQuotas[SalesAmountQuota]),1 ) This measure using the DAX Switch function. However, to use it as a searched case expression, we use a trick where first argument returns TRUE and the rest of the conditions are evaluated against this hardcoded Boolean value. The formula normalizes the status...
-
Excel Timeline Slicers
August 5, 2014 / No Comments »
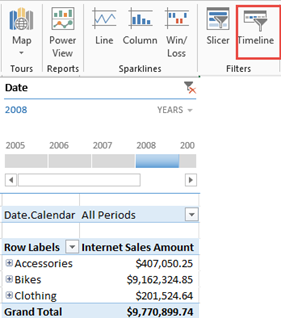
In an attempt to improve visualizations of Excel-based dashboards, Excel 2013 introduced a Timeline filter. Specifically designed to visualize dates, the Timeline filter works similarly to regular slicers which were introduced in Excel 2010. Similar to a regular slicer, Timeline connects at the connection level and is capable of filtering multiple reports. It supports also extended selections, such as to select multiple years. However, there are important differences between Timeline and regular slicers which become important when you connect to Multidimensional. The Timeline slicer always generates a subselect clause in the resulting MDX query even if a single value is selected. Because of this, the CurrentMember of the Date dimension is not set and any time calculations that dependent on [Date].[Hierarchy].CurrentMember won't work. By contrast, a regular slicer is more intelligent. If the user selection results in a single value, a WHERE clause is generated and CurrentMember works. If multiple...
-
Applied BI Semantic Model Course Available
July 19, 2014 / No Comments »
Due to the popular demand, I'm adding a new 5-day Applied BI Semantic Model training course to our training classes. This course reflects the growing need of BI developers to implement both Tabular and Multidimensional semantic models and acquire the necessary knowledge in a compressed educational format. I'm teaching this class for 30 developers next month alone. Targeting BI developers, this intensive 5-day onsite class is designed to help you become proficient with Analysis Services and acquire the necessary skills to implement Tabular and Multidimensional models. Use the opportunity to ask questions and study best practices that will help you implement scalable and secure organizational models.
-
Power View Can’t Load Power Pivot Models
July 8, 2014 / 1 Comment »
Scenario: You have created an SSRS application in SharePoint and specified that the application pool would use a specific domain service account that is designated to SSRS. When you attempt to create a Power View report from a deployed Power Pivot model, you get the following error: An error occurred while loading the model for the item or data source '<path to Excel file>'. Verify that the connection information is correct and that you have permissions to access the data source. Here is the full stack: <detail><ErrorCode xmlns="http://www.microsoft.com/sql/reportingservices">rsCannotRetrieveModel</ErrorCode><HttpStatus xmlns="http://www.microsoft.com/sql/reportingservices">400</HttpStatus><Message xmlns="http://www.microsoft.com/sql/reportingservices">An error occurred while loading the model for the item or data source '<path>'. Verify that the connection information is correct and that you have permissions to access the data source.</Message><HelpLink xmlns="http://www.microsoft.com/sql/reportingservices">http://go.microsoft.com/fwlink/?LinkId=20476&EvtSrc=Microsoft.ReportingServices.Diagnostics.Utilities.ErrorStrings&EvtID=rsCannotRetrieveModel&ProdName=Microsoft%20SQL%20Server%20Reporting%20Services&ProdVer=11.0.5058.0</HelpLink><ProductName xmlns="http://www.microsoft.com/sql/reportingservices">Microsoft SQL Server Reporting Services</ProductName><ProductVersion xmlns="http://www.microsoft.com/sql/reportingservices">11.0.5058.0</ProductVersion><ProductLocaleId xmlns="http://www.microsoft.com/sql/reportingservices">127</ProductLocaleId><OperatingSystem xmlns="http://www.microsoft.com/sql/reportingservices">OsIndependent</OperatingSystem><CountryLocaleId xmlns="http://www.microsoft.com/sql/reportingservices">1033</CountryLocaleId><MoreInformation xmlns="http://www.microsoft.com/sql/reportingservices"><Source>ReportingServicesLibrary</Source><Message msrs:ErrorCode="rsCannotRetrieveModel" msrs:HelpLink="http://go.microsoft.com/fwlink/?LinkId=20476&EvtSrc=Microsoft.ReportingServices.Diagnostics.Utilities.ErrorStrings&EvtID=rsCannotRetrieveModel&ProdName=Microsoft%20SQL%20Server%20Reporting%20Services&ProdVer=11.0.5058.0" xmlns:msrs="http://www.microsoft.com/sql/reportingservices">An error occurred while loading the model for the item or data source '<path>'. Verify that the...
-
Where is Power Pivot for SharePoint?
June 30, 2014 / No Comments »
In the process of configuring Power Pivot for SharePoint, you need to run the Power Pivot Configuration Tool, which the documentation explains well here and here. What it doesn't tell you is that unless you overwrite the URL in the Activate PowerPivot Feature in a Site Collection step, Power Pivot will be activated for the first site collection. I ran into a situation where the customer had installed My Sites and Portal site collections and the tool happily defaulted to activating Power Pivot for the My Sites site collection although we expected it to show up in the portal site. Ideally, the tool should support checking multiple site collections but it doesn't – you can specify only one. And if you don't overwrite the URL, it will pick the first site collection it finds. If your SharePoint farm has other collections, you need to manually activate Power Pivot after the...
-
Atlanta MS BI Group Meeting on Jun 30th
June 30, 2014 / No Comments »
Join us for our next Atlanta MS BI Group meeting tomorrow, Monday, June 30th, to learn about implementing BI for financial reporting. You'll also get a glimpse of the newly announced Microsoft Azure Machine Learning. Spread the word and invite your coworkers but RSVP on our website so we can plan food accordingly. Main Presentation: Microsoft BI for Financial Reporting Level: Intermediate Date: Monday, June 30th, 2014 Time 6:30 – 8:30 PM ET Place: South Terraces Building (Auditorium Room) 115 Perimeter Center Place Atlanta, GA 30346 Overview: Using a Finance data mart in SQL Server 2012, I will demo how to use SSAS 2012 and Excel 2013 for Financial Reporting. This will include the basic DW model for Financial Reporting, how to configure the key dimensions in SSAS, how to setup writeback functionality in the Finance Cube with Security, and how to use Excel for the Reporting and writeback...

We offer onsite and online Business Intelligence classes! Contact us about in-person training for groups of five or more students.