-
Presenting at SharePoint Saturday Atlanta 2014
June 3, 2014 / No Comments »
I'll be presenting "10 Ways to Maximize Your SharePoint BI Investment" at SharePoint Saturday Atlanta 2014 on June 21st. "Join me to learn how to take the most out of your on-prem or cloud SharePoint investment to promote organizational and self-service BI. We'll compare features of SharePoint editions and discuss options to visualize data from corporate databases and analytical models. Business users will learn how to share their self-service BI visualizations with teammates. We'll discuss how Office 365 and Power BI can help you implement a cloud-based environment for ease of sharing, collaboration, and information access." I hope you can make it. You can register here.
-
Atlanta MS BI Group Meeting on May 19th
May 18, 2014 / No Comments »
Join us for our next Atlanta MS BI Group meeting tomorrow, Monday, May 19th, to learn about Power Query. Spread the word and invite your coworkers but RSVP on our website so we can plan food accordingly. Main Presentation: Power Query Level: Intermediate Date: Monday, May 19th, 2014 Time 6:30 – 8:30 PM ET Place: South Terraces Building (Auditorium Room) 115 Perimeter Center Place Atlanta, GA 30346 Overview: So much data is stored on the web, yet merging it with our enterprise data can be a challenge. In this session we'll use Power Query to quickly harvest historical data about SQL Saturday from its site, combining event, session and speaker details with other publicly available data sets. We'll create custom functions with Power Query's M language to collect and transform the data from multiple web pages. We'll then move the data into Power Pivot and explore our results with...
-
Calculating Inception-to-Date Measures
May 15, 2014 / No Comments »
A requirement popped up for calculating an inception-to-date (ITD) measure. MDX CALCULATED MEMBER Aggregate(PeriodsToDate ([Date].[Calendar Hierarchy].[(All)]), [Measures].[Sales Amount]) In MDX, ITD is not much different than other time calculations, such as YTD or QTD. We only need to specify that the calculation will be performed over the top-most level of the Date hierarchy whose default name is ([Date].[Calendar Hierarchy].[(All)]. Of course, time calculations should be added to a shell dimension and a scope assignment can be used then in the cube script: Scope ( [Accounting Date].[Calendar Year].[Calendar Year].Members, [Accounting Date].[Date].Members , [Relative Date].[ITD] ); this = Aggregate ( {[Relative Date].[PTD]} * PeriodsToDate ([Date].[Calendar Hierarchy].[(All)]) ); End Scope; DAX MEASURE =CALCULATE(SUM('Reseller Sales'[Sales Amount]), FILTER(ALL('Date'), 'Date'[Date] < MAX('Date'[Date]))) In DAX, we pass a table consisting of the dates we need to aggregate over as a second argument of the CALCULATE function. We need to use the ALL function to ignore the row...
-
3 Techniques to Save BI Implementation Effort
May 11, 2014 / No Comments »
Everyone wants to press a button and have the entire BI system generated and ready to go. But things are not that simple. You know it and I know it. Nevertheless, BI automation tools are emerging with growing promises that propelled them to the Top 10 BI Trends according to the Information Management magazine. As a side note, it was interesting that the same article put Big Data in the No 1 spot despite that Gartner deemphasized the Big Data hype (based on my experience and polling attendees to our BI group meetings, many don't even know what Big Data is). While I don't dismiss the BI auto-generators can bring some value, such as impact analysis and native support of popular systems, such as ERP systems, there are also well known cautions, include vendor lock-in, a new toolset to learn, suboptimal performance, supporting the lowest feature denominator of targeted database,...
-
How to Test SSRS Data Alerts without Corporate Mail Server
May 10, 2014 / No Comments »
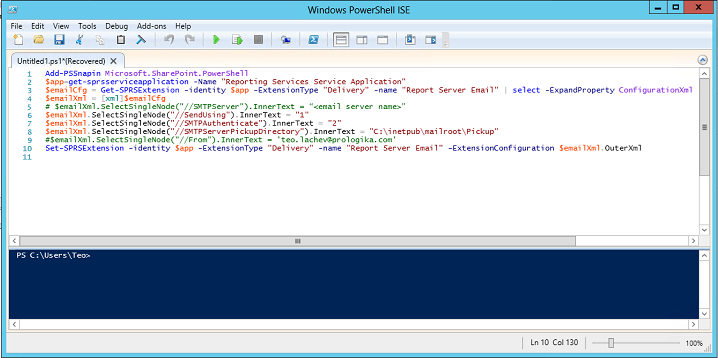
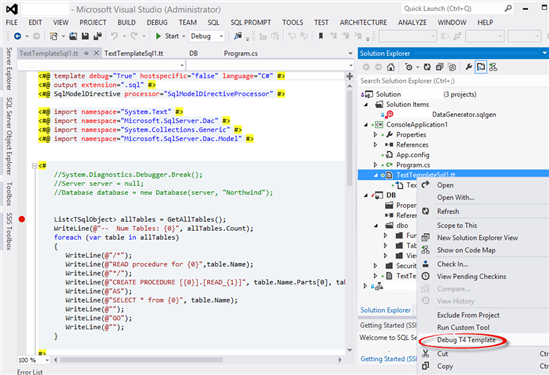
Reporting Services data alerts were introduced in SQL Server 2012 to allow business users to receive e-mail notifications based on rules they specify. Data alerts require SSRS to be configured in SharePoint integration mode. However, you'd probably run SharePoint on a VM for development and demo purposes and you might not have access to a functional mail server. The following steps allow you to configure your VM to test data alerts with a local SMTP server: Assuming your SharePoint VM is running Windows Server 2012, open Turn Windows Features On and Off and add the SMTP Server feature. This will install a local SMTP server. Open IIS Manager 6.0 and start the SMTP Virtual Server. Configure the SMTP server to allow relay. Because SSRS 2012 integrates natively with SharePoint, you can't use the report server configuration files to directly change the SSRS settings. Instead, you must use PowerShell as I...
-
Point-to-point Geo Adventures
May 5, 2014 / No Comments »
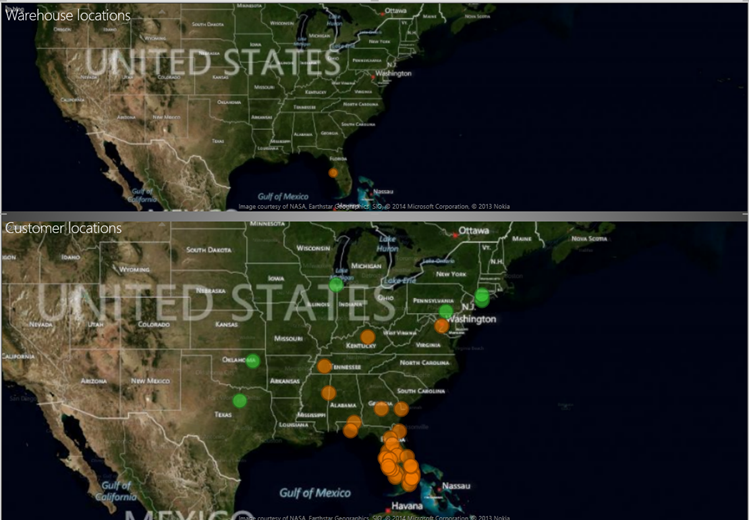
Scenario: You need to visualize point-to-point geospatial data, such as routes from an origin location to destinations. The map region in Reporting Services (Report Designer or Report Builder) supports point-to-point mapping but more than likely your users would prefer an interactive report. As they stand, neither Power View nor Power Map support point-to-point mapping. Further down on the limitation list, Power View doesn't support layers while Power Map does support layers but doesn't support filtering, e.g. to allow the end user to select a specific origin. Point-to-point mapping is a frequently requested feature which I hope Microsoft will implement in a not so distant future. Meanwhile, you need to resort to workarounds. Workaround 1: If all the user wants to see is how far the destinations are located relative to a specific origin, consider creating a Power View report with two maps. The first map would allow the user to...
-
SQL Server Events in Atlanta
April 22, 2014 / No Comments »

Next week will be SQL Server-intensive and your humble correspondent will be heavily involved: Monday, April 28th: Power BI presentation by Brian Jackson, Microsoft for Atlanta MS BI Group with Pyramic Analytics sponsoring the event. This presentation will cover new and compelling Power BI features including: the data manipulation of Power Query, Power BI Sites, the Data Steward Experience, natural language BI using Power Q&A, and mobile BI functionality. There will also be a technical discussion of the Power BI architecture as it relates to authentication, storage, data refresh and the concept of self-service information management. Friday, May 2nd: Three SQL Saturday precon sessions (Deep Dive into the Microsoft BI Semantic Model by Teo Lachev, SQL Performance Tuning & Optimization by Denny Cherry, and What the Hekaton!? A Whole New Way to Think About Data Mgmt by Kalen Delaney). Ping Stuart Ainsworth on Twitter at @codegumbo for $20 discount! Saturday,...
-
Starting SSIS 2012 Job Remotely
April 18, 2014 / No Comments »
Scenario: Inspired by the new SSIS 2012 capabilities, you've managed to convince management to install SSIS 2012 on a new server for new ETL development. But your existing ETL is still on SQL Server 2008 (or R2) and there is no budget for migration and retesting. You want to start SSIS 2012 jobs from the 2008 server, e.g. in SQL Server Agent on completion of a certain SSIS 2008 job. Solution: Courtesy to Greg Galloway for clueing me on this, thanks to its CLR integration, SSIS 2012 supports initiating jobs via stored procedure in the SSIS catalog. Although the process could benefit from simplification, it's easy to automate it, such as (you guessed it) with an SSIS 2008 calling package. It goes like this: Call catalog.create_execution in the SSISDB database to create an execution for the SSIS job. At this point, the job is not started. It's simply registered with...
-
How to Cluster Analysis Services
April 17, 2014 / No Comments »
Some scenarios require a fault-tolerant SSAS installation. In a real-life project, an active-active cluster met this requirement. Instead of installing an active-passive cluster where one node just plays a sitting duck waiting for the active node to fail, with the active-active cluster we had two active nodes to distribute processing and achieve high availability. The first node had the SQL Server database engine hosting the data warehouse database while the second had SSAS. If one of the nodes would fail, its services will fail over to the other. Configuring a failover cluster requires many steps. Luckily, Microsoft just published a whitepaper "How to Cluster SQL Server Analysis Services" by Allan Hirt (SQL Server MVP) that includes step-by-step instructions of how to configure SSAS (Multidimensional or Tabular) on a Windows Server failover cluster (WSFC). Although not discussed, instead of WSFC, yet another way to achieve high tolerance that gains popularity is...
-
BISM Drillthrough Capabilities
April 16, 2014 / No Comments »
All the three BISM flavors (Multidimensional, Tabular, and Power Pivot) supports default drillthrough to allow the end user to see the level of details behind an aggregated measure by just double-clicking the cell. However, the implementation details differ. Multidimensional supports default drillthrough on regular measures only, that is, measures that bind to columns in fact tables. Multidimensional doesn't support drillthrough on calculated measures, even if these measures are simple tuples, such as ([Measures].[Sales Amount], [Product].[Product Category].[Some Category]). On the other hand, Power Pivot and Tabular don't have the concept of regular measures and they support only calculated measures. Even if the user drags a column to the Values zone on a pivot or Power View report, the tool creates an implicit measure with a DAX formula behind the scenes, such as =SUM(ResellerSales[Sales Amount]). Because of this, Power Pivot and Tabular appears to allow drillthrough on any measure. However, the drillthough...
Training
 We offer onsite and online Business Intelligence classes! Contact us about in-person training for groups of five or more students.
For more information or to register click here!
Books
 Learn Power BI at your own pace with our latest book Applied Microsoft Power BI. Targeting information workers, data analysts, pros, and developers, It is designed as an easy-to-follow guide for learning how to implement BI solutions spanning the entire personal-team-organizational BI spectrum.

