Determining Power BI Relationships
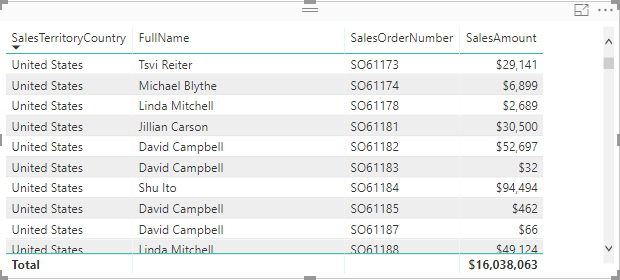
Problem: Consider the following Power BI report that shows the sum of ResellerSales[SalesAmount] by SalesTerritory[SalesTerritoryCountry], Employee[FullName], and ResellerSales[SalesOrderNumber].
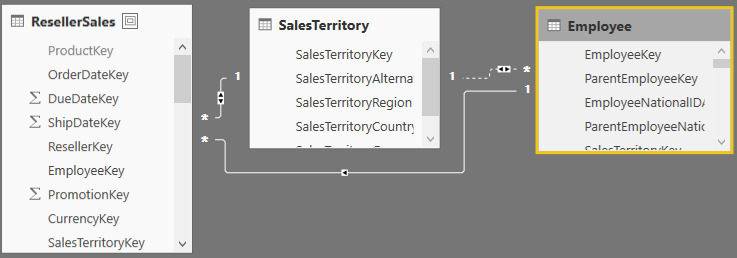
This report is based on the following schema consisting of three tables.
However, If there isn’t a direct relationship between ResellerSales and Employee, the moment you add an unsummarized field from the second table on the many side, such as Employee[FullName] after adding SalesTerritoryCountry and ResellerSales[SalesOrderNumber), you’ll get the error “Error: Can’t determine relationships between the fields”.
Solution: Interestingly, the report works fine if a summarized field, such as COUNT(Employee[EmployeeKey]) is used. In this case, the SalesTerritory dimension acts as a conformed dimension joined to two fact tables. The reason why it doesn’t work when Employee[FullName] is added is because there is no aggregation on the Employee table and the relationship between ResellerSales[SalesOrderNumber] and Employee[FullName] becomes Many:Many over SalesTerritory which is now a bridge table. One employee may be associated with multiple sales and a sale can be associated with multiple employees. How do we solve this horrible problem? There are at least two ways:
- If possible, create a direct relationship between ResellerSales and Employee. Now you have two dimensions joining a fact table and there is no ambiguity.
- If the only join option is to relate Employee to SalesTerritory, set the relationship’s cross filter direction to Both. This will indirectly filter the ResellerSales table and might achieve the same result. For each employee on the report, Power BI travels the relationship to find the related territories at the lowest granularity. In Adventure Works, the lowest granularity of the SalesTerritory table is the territory region, such as South East, so the cross filter set to Both will select all regions that are associated to the current employee. From there, it will get the sales orders and sales associated with these regions.
Where the report using the second option differs from the first is if there are multiple employees associated with the same region causing the sales order numbers to repeat although the report total is the same.
Power BI supports flexible schemas but how you construct relationships may impact the report results. You should always start with a simple schema and grow in complexity if needed.


