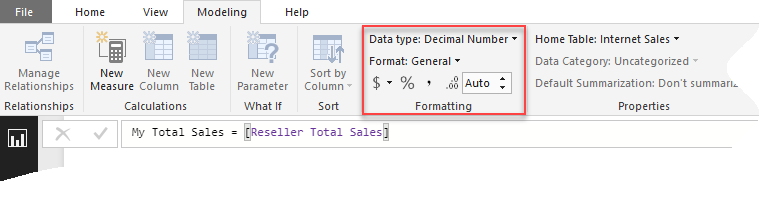
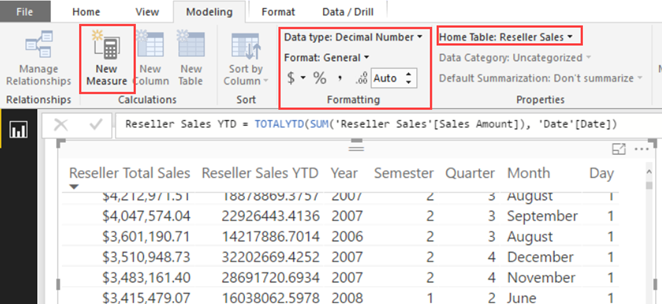
Scenario: You want to overwrite the formatting of some field in a Power BI Visual, such as in the case of showing the field in one visual with decimals and then in another without decimals. Or, you might want to overwrite the default format when connected live to a semantic model. You search left and right, bing the Internet, and still no clue as to…
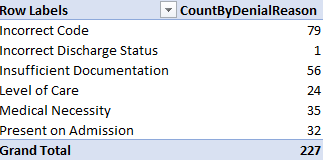
Scenario: You have a concatenated field stored in a table. For example, a medical claim might have several denial reasons. Instead of representing this as a Many-to-Many relationship, you've decided to store this a comma-delimited field, such as to allow the user to see all codes on one row. However, users are asking to produce counts grouped by each reason code, such as this one:…
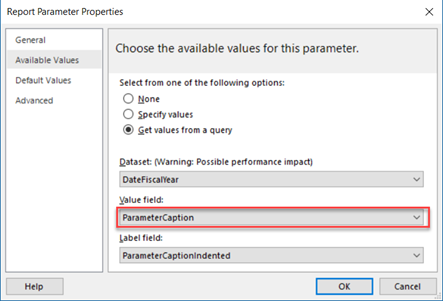
UPDATE: Microsoft has added support for multi-valued parameters in the DAX Query Designer. Please read the discussion thread below for more info. You can use the approach discussed in this article if you need more control over the parameter handling, but the Microsoft-provided way should suffice for most cases and it's easier to implement. Déjà vu today with a twist. SSRS multivalue parameters in SSAS…
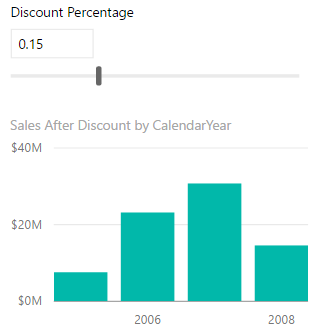
Veteran Excel users might have used the Excel What-if feature that let you try several different sets of values in one or more formulas to explore various outcomes (scenarios). The August release of Power BI Desktop introduces a similar feature. You start by defining a What If parameter from the Modeling tab. Don't confuse the What If parameter with a query parameter which is used…
The May release of Power BI Desktop adds the ability to define DAX calculated measures when Power BI Desktop is connected live to a Tabular model or Power BI datasets. This is conceptually similar to defining MDX calculated members in Excel connected to a cube. The measure definitions are local to the Power BI Desktop model (the Tabular model is not modified). You can do…
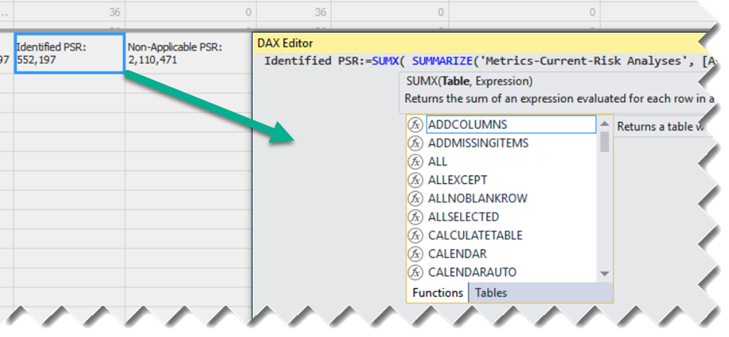
The Tabular toolset is getting better. One thing that I miss from Multidimensional is the cube script that lets you view all custom calculations in one place so that you can organize them any way you want, add comments, etc. This is why I contributed to the DAX Editor tool. Microsoft has taken notice and introduced a tool (also called DAX Editor) in the latest…
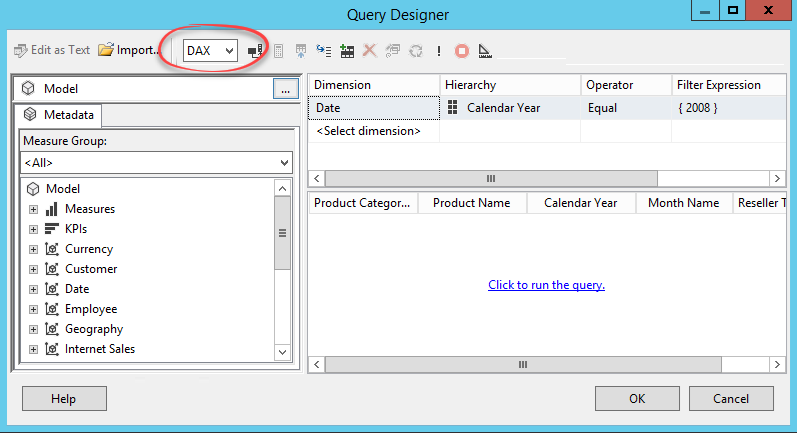
Analysis Services Tabular has gained a lot of momentum for implementing organizational semantic models but its toolset has been lacking. SSRS developers had to rely previously on the MDX Query Designer to send MDX queries to Tabular. If DAX queries were preferred (and they often are for better performance since DAX is the native Tabular query language), developers had to type in DAX manually. And if…
Sometimes, you might run into a scenario that requires an aggregate over an aggregate. Consider the following report: The AvgOrderAmount has a simple calculation: SUM(Sales)/SUM(Qty). This calculation is applied uniformly. The Total line would divide 300/7 and will return 42.86. However, what is the user wants the result in the DesiredAvgOrderAmt column which produces a simple average over the details (50+40)/2. This could be accomplished by…
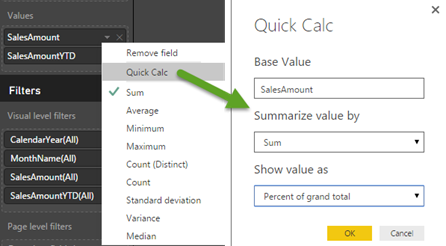
DAX is very powerful but it could entail a steep learning curve for novice users. Power BI Desktop has started on the road of delivering pre-packaged calculations. The first one is Percent of Grand Total. Once you add a measure to the Values zone, you can expand the measure drop-down and click Quick Calc. This is similar to how you would pick one of the…
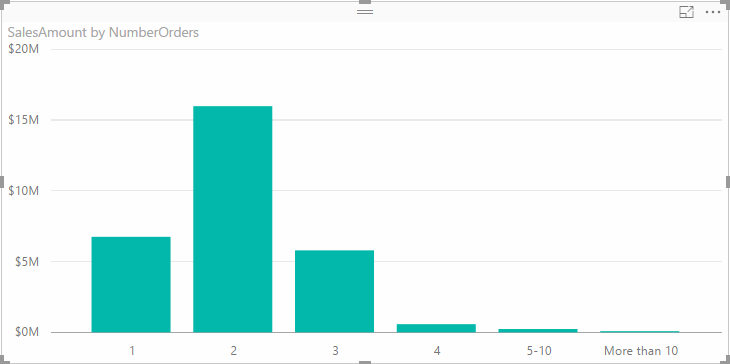
I had an inquiry about how to implement in Power BI/Power Pivot/Tabular something similar to the new Level of Detail (LOD) Expressions feature in Tableau 9.0. A more generic question would be how to turn a measure into a dimension so that you can analyze your data by the distinct values of the measure. Now, in my opinion, most real-life requirements would go beyond just…