First Look at Power BI AutoML
In my previous “First Look at the New Power BI Integration with Azure ML” blog, I showed you how Power BI will make it very easy to integrate it with Azure Machine Learning and Cognitive Services. Data scientists today have plenty of options to create predictive models but all of them have one thing in common: expertise in data science and statistics.
The promise of AutoML is to bring predictive analytics to data analysts just like self-service BI brought analytics to business users.
Let’s see how AutoML works based on what’s in the private preview (the usual disclaimer is that things will probably change). To start with, AutoML requires a dataflow (a note to Microsoft here is that AutoML will become more pervasive if it’s available in Power BI Desktop and it doesn’t require a premium capacity). In the private preview, AutoML requires the following steps. Presumably. the first (and most difficult step), preparing the dataset and cleansing the data is already done and available as a dataflow entity:
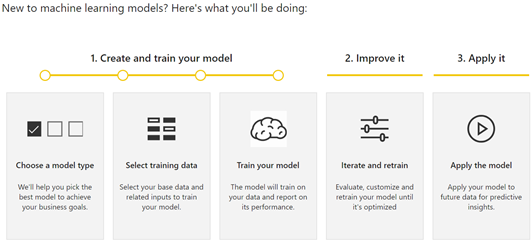
Choosing model type
In private preview, choosing a model type requires the data analysts to select one of four model types:
- Binary Prediction – a type of a classification task where the model predicts only two (Boolean) states, such as if a customer is a potential buyer or not. It requires a Boolean outcome field.
- General Classification – a type of a classification task where the model predicts more states, such as if the customer’s risk falls in Low, Medium, or High risk.
- Regression – Similar to classification, regression predicts a numeric outcome, such as the customer risk on the scale from 0 to 10.
- Forecasting – Time series forecasting, such as to predict the revenue for future months.
I’d argue here that if want to make this super easy, we shouldn’t be asking a business user about the type of model. Power BI can simply examine the field that needs to be predicted, which happens in the next step, and suggest the model type so the current choices can be collapsed between Classification and Forecasting.
Selecting training data
Next, you need to select the field that needs to be predicted (outcome field) and input columns. This step is the most important and arguably the most difficult even for data scientists because you need to have a business domain knowledge to guess which input fields are the most significant. Modelers tend to lean on the safer side by selecting all fields which dilutes the model accuracy. Here, it will be nice if AutoML suggests which fields are the most significant. AutoML has a validation report that shows you the key influencers after the model is ready, but it would be better if it has similar feature to aid you in the field selection.
The wizard’s next step depends on the mode type. For binary classification, it asks you to specify the field names for two states, such as Buyer and NonBuyer.
Training the model
The model is ready but requires an entity refresh to train it. At this point, AutoML generates two additional entities for providing inputs for testing and training data, such as 80% of the input dataset is used to train the model (generate the predictive patterns) and 20% is used to test the model accuracy against the historical data. The assumption here is probably let the user to fine tune the training and testing data if they want to have more control. I think though that this is too technical, and it should be handled internally by AutoML to reduce the number of entities and overall complexity.
The actual model exists on the Power BI capacity. All the training happens there, and the resulting patterns are stored there. Data does not leave the capacity and the model is not published as an experiment in Azure ML.
Iterating and retraining
One thing is to prepare the model, which is easy with AutoML, but another thing is to make sure that the model is useful and results in a true gain. This is where things get technical but AutoML seeks to simplify this with a validation report. The report has three tabs:
- Model Performance – The most important information here is the key influencer charts that show you which input fields are the top predictors. You should review this chart and possibly remove input fields that are insignificant. This page also has the only input change you can make to influence the model prediction, which is to specify the probability threshold. For example, for Binary Prediction you can change the probability threshold to 50% to indicate that the customer is considered a buyer if the predicted score is equal or above 50%.
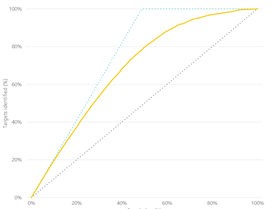
- Accuracy Report – The most important information on this page is the so called lift chart. You want to verify here that the solid line is above the diagonal line which represents a random guess, i.e. if we don’t use predicative analytics but just randomly guess which customers will become buyers.

- Technical Details – This page has additional technical information which will be over the head of data analysts but could be useful to pass them on to the data scientist, such as what parameters were used for the model algorithm.
Applying the model
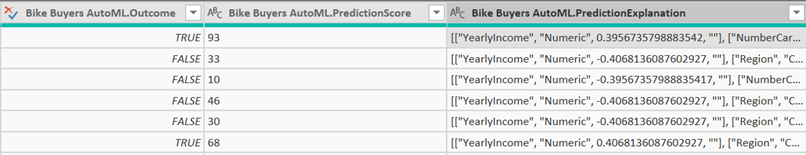
Now that you have the model trained, you can operationalize it by applying it to your original entity, that was used to train the model, or to another entity, such as a list of new customers, as long as it has the same fields that are used as input to the model. Applying the model to an entity adds yet another (computed) entity which has the original fields, plus the predicted. For example, the Binary Prediction model type adds two new fields:
- Outcome – TRUE if the model predicted that the customer will be a buyer and FALSE otherwise.
- PredictionScore – The likelihood of the prediction from 0 to 100.
- PredictionExplanation – Additional details that include the weights of each input field to explain the predicted outcome.
So, once all is done, you’ll have 7 entities:
- Original entity
- AutoML entity – trains the model
- Training data – entity used for training the model
- Testing data – entity used for testing the model
- AutoMLScore – a function used for scoring the input dataset
- AutoMLPollingQuery – a helper entity which I believe returns the identifier of the model
I’d personally prefer less entities. For example, I’d rather see the predicted fields added to the entity to which the model is applied to, as opposed to having another “enriched” entity.
Power BI AutoML brings predictive analytics to data analysts. Powered by ML.NET, AutoML automates the creating of predictive models to handle common predictive tasks, such as classification and forecasting. I hope Microsoft simplifies the process by reducing the number of entities and refreshes required, and by bringing AutoML to Power BI Desktop.


