Prologika Newsletter Summer 2019
 After learning how to model the data properly (the most important skill), DAX would be the next hurdle in your self-service or organizational BI journey. You won’t get far in Microsoft BI without DAX. This letter shares a tip on how to identify DAX performance bottlenecks by using a recent feature in Power BI called Performance Analyzer.
Learning DAX
 Before I get to Performance Analyzer, I’m excited to announce my latest book: Applied DAX with Power BI: From zero to hero with 15-minute lessons. This book was born out of necessity. In my consulting practice, I had been teaching and implementing Power BI and Analysis Services Tabular, and people were constantly asking for DAX book recommendations. Indeed, DAX is not an easy topic and has its ways to humble even experienced practitioners. There are a few good reference books out there, but they could be somewhat overwhelming for novice users. So, I turned my classroom and consulting experience into this book and designed it as a self-paced guide to help you learn DAX one lesson at a time.
This one was a different book to write. Unlike my other books, which tend to be heavy, this book is smaller (220 pages). Regardless, it took me a while to write it. The book also adopts a lesson-based approach, so the reader can learn and practice a specific DAX concept quickly. There are usually three sections in each lesson: Practice (with step-by-step guidance), Outcome (a visual that shows the result), and Analysis (explaining why DAX works this way). Most lessons are five to six pages long, and it should take no more than 15 minutes to complete the lesson’s exercises (you can download and view a sample lesson from the book page).
And if you do one lesson per day, you’ll be a DAX expert in a month!
Analyzing DAX Queries
“This report is slow!” I hope you never hear this, but the chances are that you will sooner or later. No one likes watching a spinning progress indicator and waiting for the report to show up. Tucked in the View ribbon of the Power BI Desktop recent builds is a handy tool called Performance Analyzer that can help you identify slow queries. It’s easy to use:
- In Power BI Desktop, click the View ribbon and check the Performance Analyzer setting. This will open the Performance Analyzer pane.
- Click Start Recording in the Performance Analyzer pane. Once you start recording, any action that requires refreshing a visual, such as filtering or cross-highlighting, will populate the Performance Analyzer pane. You’ll see the statistics of each visual logged in the load order with its corresponding load duration.
- You can click the “Refresh visuals” link in Performance Analyzer to refresh all visuals on the page and capture all queries. However, once you are in a recording mode, every visual adds a new icon to help you refresh only that visual.
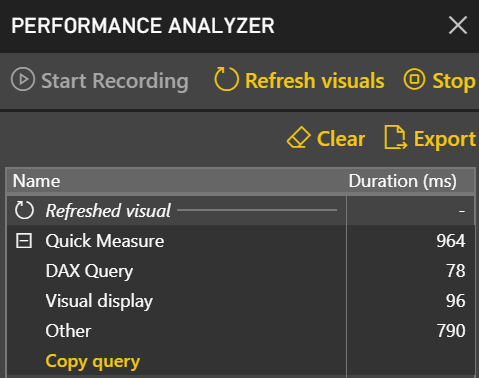
Performance Analyzer captures the following information:
- DAX query – The length of time to execute the query.
- Visual display – How long it took for the visual to render on the screen after the query is executed.
- Other – This is the time that the visual spent in other tasks, such as preparing queries, waiting for other visuals to complete, or doing some other background processing.
Although not as comprehensive as DAX Studio, Performance Analyzer is a quick and easy way to get an overall idea of what impacts your report page performance. Performance Analyzer is currently only available in Power BI Desktop and it’s not available in Power BI Service.

Teo Lachev
Prologika, LLC | Making Sense of Data
Microsoft Partner | Gold Data Analytics
![]()


