Posts

Divorce Your Methodology

At the Atlanta BI meeting last night, there was a question from the audience about differences between Inmon and Kimball and which methodology should be followed when implementing a data warehouse. I’ll recapture my thoughts and the feedback I shared.

As BI practitioners, most of us use methodologies and it’s easy to fall in love with a specific methodology. But sometimes methodologies conflict each other. So, don’t feel very strongly about methodologies. Instead, study them and try to synthetize their best. The best methodology is the one that delivers a business solution in the most practical and simple way. Back to Inmon vs Kimball, I have deep respect for both of them. They both contributed a lot to data warehousing that forms the backbone of modern BI. Both of these two methodologies aim to consolidate data and promote a single version of the truth. Both of them are “pure” database-focused and vendor-neutral methodologies for designing data structures. But they also differ in significant ways. This table summarizes the high level differences between the two methodologies.

Inmon Kimball
APPROACH Top-down
Data warehouse first, data marts later
Bottom-up
Data marts first, data warehouse later
SCHEMA Normalized (3NF) schema Denormalized (star) schema
HISTORY All history needs to be captured Depends on business requirements
Type 1 vs Type 2 dimensions


So, which one to follow? My answer is that there is a place for both. Consider the following BI architectural view.

012914_0241_DivorceYour1

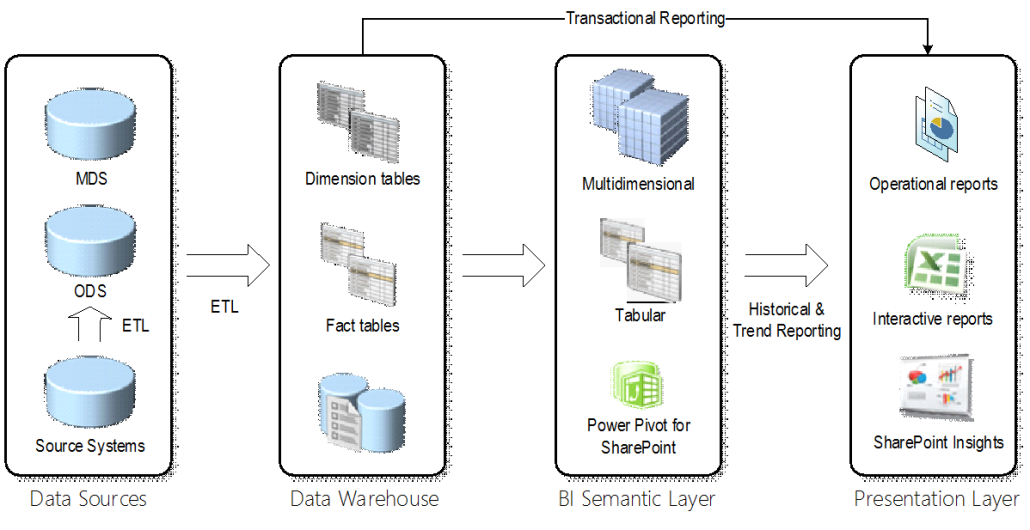
Data comes from veriety of data sources. Some data, such as Products, Customers, Organizations, represents master data that should be ideally maintained in a separate repository, e.g. in Master Data Services. However, most of the source data is not master data and must be staged before it’s imported in the data warehouse. Instead of a transient staging database whose data is truncated with each ETL run, consider an ODS-style staging database that maintains historical changes.

Start_Date End_Date Store Product Deleted_Flag
1/1/2010 5/1/2010 Atlanta Mountain Bike 1
5/2/2010 3/8/2012 Atlanta Mountain Bike 2
3/9/2012 12/31/9999 Norcross Mountain Bike 2

The Start_Date and End_Date columns are used to record the lifespan of each record and create row new versions each time the source row is changed. The example shows three changes that a given product has undergone. This design offers two main benefits:

1.    It maintains a history of all changes that were made to all columns to all tables. Typically, OLTP systems don’t keep track of changes so the staging database can be used to record changes.

2.    It maintains a full backup of the data. If a data warehouse needs to be reloaded, its history can be recreated from the staging database.

This ODS design is effectively your Inmon methodology in practice. For the data warehouse, I’d go with Kimball dimensional modelling. Dimensional modelling is a practical design technique whose goal is to produce a simple schema that is optimized for reporting. As far as data marts, I’m not so excited about moving data in or out of the data warehouse. In most cases, the most practical approach would be to implement a single data warehouse database and extend it as more subject areas come onboard. However, large organizations might benefit from data marts. For example, a large organization might have an enterprise data warehouse but for whatever reasons (usually IT not having enough resources), it might be difficult or not practical to extend it with a new subject areas. Then, this department might spin off its own data mart, such as on a separate database server (even from a different vendor, e.g. DW on Oracle and DM on SQL Server).

Ideally, the data mart should be able to reuse some of conformant dimensions from the data warehouse instead of implementing them anew. In reality, though, the enterprise bus could remain a wishful thinking. Having been left on his own devices, that department would probably need to implement the dimensions from the data they work with. For example, if this is an HR data mart, they would probably source an Organization dimension from PeopleSoft which is where their core data might come from.

With the risk of repeating myself, I want to reemphasize the role of the semantic layer which plays a critical role in every BI architecture. If you are successful implementing an enterprise bus consisting of a data warehouse and data marts (hub and spokes architecture), the semantic layer can provide a unified view the combines these data structures. For more information about the semantic layer benefits, refer to my newsletter “Why Semantic Layer“.

"Bus Matrix – the Foundation of your Dimensional Data Model" Atlanta BI Presentation

Our next Atlanta Microsoft BI meeting will be on Monday, January 27th. The main presentation is “Bus Matrix – the Foundation of your Dimensional Data Model” the speaker is Bill Anton. The meeting will be sponsored by TEK Systems. I hope you can make it.

The Bus Matrix is the cornerstone of a successful Dimensional Data Modeling strategy. It serves many purposes: from communicating requirements, capabilities, and expectations with the business users down to the prioritization and delegation of tasks across the development team. Join me in this session and learn what a Bus Matrix is, why it is the single most important document in your Data Warehouse project, and what can go wrong without it. We’ll also cover several approaches for creating and maintaining the Bus Matrix.

Bill Anton is an independent consultant whose primary focus is designing and developing Data Warehouses and Business Intelligence solutions using the Microsoft BI stack. When he’s not working with clients to solve their data-related challenges, he can usually be found answering questions on the MSDN forums, attending PASS meetings, or writing blog posts over at byoBI.com.

Atlanta BI Group Meeting on Monday

The Atlanta Microsoft BI Group will have a meeting tomorrow, June 24th.

Main Presentation: Developing a Custom Task in SSIS 2012 Level: Intermediate

Date: June 24th Time 6:30 – 8:30 PM ET

Place: South Terraces Building (Auditorium Room) 115 Perimeter Center Place Atlanta, GA 30346

Overview: Integration Services uses tasks to perform units of work in support of the extraction, transformation, and loading of data. Integration Services includes a variety of tasks that perform the most frequently used actions, from executing an SQL statement to downloading a file from an FTP site. If the included tasks and supported actions do not completely meet your requirements, you can create a custom task. In this session we will demonstrate to you how to create custom SSIS tasks.

Speaker: Aneel Ismaily was born and raised in Karachi, Pakistan. He moved to the United States at the age of 18. Since then he has lived in Atlanta, GA. Aneel did his undergrad in Computer Science (BS) from Georgia State University (GSU) with concentration in Database Systems. He recently graduated with a professional MBA degree from Georgia State University with concentration in Organization Management and Entrepreneurship. Aneel owns MSBI Consulting, an IT consulting firm. MSBI Consulting provides Business Intelligence solutions to its customers. Prior to MSBI Consulting, Aneel was employed with Intellinet where he was working as a Principal Consultant. Before that he worked at RDA Corporation where he was working as a Sr. Software Engineer and before RDA he worked as a BI Solution Developer at BCD Travel. You can learn more about Aneel at http://www.linkedin.com/in/aismaily.

Sponsor: 3Sage Consulting Founded and led by real consultants who really care about the end deliverable, 3sage is untangling some of the most complex data issues in business today.

Prototypes with Pizza: Real-time BI with Big Data Demo by Teo Lachev

So, you have classic BI, self-service BI, Big Data BI, predictive BI, but do you have real-time BI? To demonstrate how classic BI, Big Data, and real-time BI can play together, Microsoft put together a great sample – Big Data Twitter Demo.

Record Attendance for Atlanta BI Group Last Night

We had the pleasure to have some 70 people attending our January 30th, 2012 meeting of the Atlanta BI group. Our sponsor, Matrix Resources, was kind enough to give us the auditorium. FisionIO sponsored the meeting. Phil Per-Lee did us a “Prototypes with Pizza” presentation, titled Connecting the Dots. And, Carlos Rodrigues rocked the stage with the main presentation about dimensional modeling.

I’ve uploaded pictures to the Photo Gallery section of our website and the slides to the Resources section. We’ve got some cool presentations lined up for next few months. Check our Calendar section to see what’s coming.

Atlanta BI Record Attendance Last Night

We had a blast light night at Atlanta BI and ran out of space with a record attendance of some 60+ people. This is phenomenal given that we are amidst a vacationing season. Jonathan Lacefield from Daugherty gave us a great intro presentation of Analysis Services. Michael Clifford shows cool Integration Services tips. And, Beth Lenoir from Daugherty was kind to sponsor to event and arrange for some great food. Whether it was Jonathan’s presentation, tips, or the food, the atmosphere was electrifying. Thanks to everybody for making last night a fantastic success!

4505.IMG-20110627-00036.jpg-550x0

Atlanta BI SIG December Meeting

If you are use Microsoft BI, live in or within driving distance to Atlanta, and don’t know about the Atlanta BI SIG, you are missing a lot. At our last meeting we had some 50+ people and our attendance is growing! Due to the holidays, Atlanta BI SIG will not have a meeting at the end of November and December. Instead, our next meeting will be held on December 6th. I updated the Atlanta BI SIG home page to announce the December meeting.

End of the year is a good time for reflecting on the past and planning for the future. Bob Abernathy from Strategy Companion will present BI past, present, and future trends. He will also show us how Strategy Companion integrates with Analysis Services.

Topic:         BI: Then and Now?
  Level: Beginner
Date: Monday, December 6, 2010
Speaker:
 
Bob Abernethy, SVP & GM of Strategy Companion Corporation
Bob Abernethy is SVP & GM of Strategy Companion Corporation. A veteran of Oracle Corporation and Siebel Systems, Bob brings over twenty years of software industry experience to his discussion with customers about their Business Intelligence implementations. Bob received his Bachelor of Science degree from Cornell University in New York and his Masters of Management Information Systems from West Coast University in Southern California. the current president of the Kansas City SQL Server Users Group.
Overview:
 
We will begin by taking a look how the focus and characteristics of Business Intelligence have changed over the last 25 years. We will also discuss the recent history of Microsoft’s focus on BI, and will take an in-depth look at another approach to SQL Server-based BI provided by Strategy Companion Corporation. You will see why companies such as Citigroup, L’Oreal, Honeywell, DataQuick, and many others have embraced Analyzer, Strategy Companion’s award-winning front-end to Analysis Services, for their Business Intelligence applications. You’ll see why SQL Server magazine recently called Analyzer “the best solution to complete the Microsoft BI platform.” (Editor’s Best Award, December 2009.) And you’ll learn ways to quickly and add significant value to your SQL Server-based data – the kind of value business people will be able to see, understand, and appreciate.
  
Location: Matrix Resources Dunwoody Office
Sponsor: Strategy Companion Corporation
See the overview for the main presentation.

See you there!

Atlanta BI SIG September Meeting

Atlanta BI fans, join our next Atlanta BI SIG meeting! Mark Tabladillo (Ph.D., Industrial Engineering, MCAD.NET, MCT) will show us how to do data mining with PowerPivot. And Dundas will demonstrate their latest BI offering – the Dundas dashboard. Here are the details:

Please RSVP to help us plan food as follows:

  1. Go to the Atlanta BI home page (atlantabi.sqlpass.org).
  2. Choose Yes and submit the RSVP survey found at the right top corner of the page.


Main Topic:         Data Mining with PowerPivot 2010
  Level: Intermediate
Date: Monday, September 27, 2010
Time: 6:30PM
Location Matrix Resources

115 Perimeter Center Place

Suite 250 (South Terraces Building)

Atlanta, GA 30346

Speaker:


Mark Tabladillo (Ph.D., Industrial Engineering, MCAD.NET, MCT)
Mark Tabladillo provides consulting and training for data mining with Solid Quality Mentors. He has taught statistics at Georgia Tech and for the graduate business school of the University of Phoenix. Mark has years of deep experience with the SAS System, and has presented at many local, regional, and national technical conferences. Mark produces a data mining resource and blog at http://www.marktab.net. the current president of the Kansas City SQL Server Users Group.
Overview:


Excel provides a compelling and ubiquitous interface for Microsoft Data Mining. With new features available through PowerPivot, business users can apply the technology through a well-designed infrastructure of Microsoft technologies. This presentation will welcome any newcomers to data mining, and provide interactive demos which highlight data mining through these technologies.


Location: Matrix Resources Dunwoody Office
Sponsor
Presentation:
Dundas

Dundas will present their latest BI offering: Dundas Dashboard. Dundas Dashboard is a flexible, turnkey solution for the rapid development of business dashboards. Whether you are leveraging an existing BI infrastructure/application or starting a standalone project from scratch, Dundas offers the industry’s most cost-effective platform for creating/deploying sophisticated digital dashboards and empowering users quickly and easily.

Atlanta BI Group First Meeting Topic Announced

I’ve just updated the Atlanta BI Group home page to announce the topic for our first meeting on August 23th. Given the great interest surrounding Self-service BI, I’ll present “Self-service BI with Microsoft PowerPivot”.

Hope you can make our first meeting!

Atlanta.MBI Website

The website for the Atlanta Microsoft Business Intelligence SIG is up and running although it’s still work in progress.

http://atlantabi.sqlpass.org

1. Please register.

2. Please fill in the two polls on the first page for the first meeting attendance and topic of interest.

3. You can post suggestions for our first meeting on the Discussions page (Meetings forum) as a reply to my first post there.

4. Please use the General forum in the Discussions for any general questions.

5. Please spread the news and redirect Atlanta BI fans to http://atlantabi.sqlpass.org.

Venue for Atlanta.MBI Found

The great search for a meeting place for the Atlanta BI SIG is over! I am happy to report that I found the perfect place. Matrix Resources graciously offered to host and sponsor our meetings in a training room at their premises at 115 Perimeter Center Place #250, Atlanta, GA, 30346. I visited their location and another location today and I think their place is great. The room is capable of accommodating 50 people and has a projector. The location is nice too since I was looking for place around this area to accommodate the traffic concerns of as many people as possible. I personally live in Norcross and it would have been nice to take advantage of the Data Profit’s meetup offer but it would have been too selfish J

I also booked the meeting days for the rest of the year. I suggest we meet up every last Monday of the month from 6:30 – 8:30 PM as follows:

8.23, 9.27, 10.25, 11.22 and 12.27

Our first meeting will on be August 23th at 6:30 PM.

My focus now is to put together the Atlanta BI website that will be hosted on sqlpass.org. I’ll let you know when it’s ready so you could register and stay on top of the latest announcements. Stay tuned!