Posts

Organizational BI vs. Personal BI

This is a blog post that I’ve been planning for a while. With the ever-increasing power of laptops and desktop computers and declining hardware prices, personal BI is on the rise. Typically, a new technology usually has a self-propelled upward spiral to a point – vendors are talking about it to clients, executives are talking about it on golf courses, consultancies are talking about it, and are rushing to fill in the void. There is a lot of money to be made with a lot of misinformation and sometimes outright lies. I’ll be quick to point out that personal BI alone is not going to fix your BI and data challenges. However, it can complement organizational BI well and open possibilities when organizational BI alone is not enough. You might find the following information interesting when you’re contemplating which way to go.

Organizational BI

Organizational BI is a set of technologies and processes for implementing an end-to-end BI solution where the implementation effort is shifted to BI Pros. An example of a “classic” (and somewhat simplified) organizational BI solution follows.
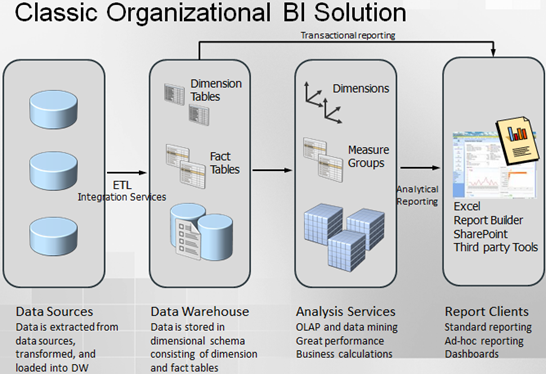
052712_2221_Organizatio1

PROS

  • Pervasive business intelligence – Available to all users across the enterprise, subject to security policies.
  • Single version of the truth with trusted data – Provides accurate and trusted analysis and reporting. Data is clean, validated, and secure.
  • Rich feature set –OLAP, data mining, KPIs, dashboards. For more information about using Analysis Services for organizational BI, read my blog Why an Analytical Layer?
  • Performance – High performance and scalability with massive data volumes

CONS

  • Effort – Significant development effort might be required
  • Skills – Specialized skills required (BI pros)
  • More rigid – Less flexible to react to new business requirements


PERSONAL BI

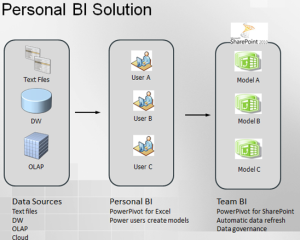
Personal BI provides business users tools for implementing ad-hoc BI models with help, guidance and supervision from IT (see below). In the Microsoft BI world, the tool for personal BI is PowerPivot with its two flavors: PowerPivot for Excel and PowerPivot for SharePoint.
052712_2221_Organizatio2

PROS

  • Offloads effort from IT – Anyone can implement BI models if they have access to data. However, IT must still provide ongoing guidance and supervision, such as to provide access to data, to implement more advanced business calculations, to monitor the shared environment where the BI models are deployed. Therefore, I believe more in “managed” personal BI than just personal BI.
  • Knowledge domain expertise – Business users should know their domain better than IT.
  • Data mashups — Easy to mix data from different data sources.
  • Data exploration – Let business users explore data and tell IT what they really want before BI pros take over.

CONS

  • “Spreadmarts” – Proliferation of models. Which model do you trust?
  • Data integrity and validation issues – If users don’t import data that is already validated, such as importing data stored in the company’s data warehouse, reports probably cannot be trusted.
  • Power users – In reality, personal BI requires power users. In my experience, regular users don’t have the desire, skills, and time to create models. A case in point – a major organization decided to embrace a popular tool for personal BI but hired a consultancy to implement the reports! Have you heard from your users that they want operational reports, preferably delivered to them via subscriptions?
  • Security issues – Another burden on IT to secure data and make sure that data is not compromised when the business user imports it and share the model with another user.

So, each approach has pros and cons. Instead of exclusivity, consider using them together. For example, implement organizational BI for pervasive BI and single version of the truth, coupled with isolated scenarios for personal BI, such as when the data is not in the data warehouse or when users need to mash up data.

Why an Analytical Layer?

I had a presentation on the BI Semantic Layer and Tabular modeling for the Atlanta BI Group on Monday. Midway during the presentation, a DBA asked why we need an analytical layer on top of data. I’m sure that those of you who are familiar with traditional reporting and haven’t discovered yet Analysis Services might have the same question so let’s clarify.

  1. Semantic layer

    In general, semantics relates to discovering the meaning of the message behind the words. In the context of data and BI, semantics represents the user’s perspective of data: how the end user views the data to derive knowledge from it. As a modeler, your job is to translate the machine-friendly database structures and terminology into a user-friendly semantic layer that describes the business problems to be solved. To address this need, you create a semantic layer. In the world of Microsoft BI, this is the Business Intelligence Semantic Model (BISM). The first chapter (you can download it from the book page) of my latest book “Applied Microsoft SQL Server 2012 Analysis Services (Tabular Modeling)” explains this in more details.

  2. Reducing reporting effort

    Suppose that your boss comes one day and tells you that IT spends too much effort on creating operational reports. Instead, he wants to minimize cost and empower the business users to create their own reports. One of the nice features of Analysis Services is that the entity relationships become a part of the model. So, end users don’t have to know how to relate the Product to Sales entities. They just select which fields they want on the report and the model knows how to relate and aggregate data.

  3. Performance

    Analysis Services is designed to provide excellent performance when aggregating massive amounts of data. For example, in a real-life project we are able to achieve delivering operational reports within milliseconds that require aggregating a billion rows. Try to do that with relational reporting, especially when you need more involved calculations, such as YTD, QTD, parallel period, etc. Having an analytical layer might save you millions of dollars to overcome performance limitations (to a point) with relational reporting by purchasing MPP systems.

  4. Single version of the truth

    The unfortunate reality that we’re facing quite often is that many important business metrics end up being defined and redefined either in complex SQL code or reports. This presents maintenance, implementation, and testing challenges. Instead, you can encapsulate metrics where they belong – in your analytical model. As an added bonus, you will be able to use an expression language (MDX or DAX) that is specifically designed for business calculations. Moreover, the modeler can define key performance indicators (KPIs).

  5. Additional BI possibilities

    This goes hand in hand with 2, but the point that I want to emphasize here is that many reporting tools are designed to integrate and support Analysis Services well. For example, Microsoft provides Excel on the desktop and the SharePoint-based Power View tool that allows business users to create their own reports. An analytical layer opens also additional possibilities, such as performance dashboards.

  6. Security

    How much time do you spend implementing custom security frameworks for authorizing users to access data they are allowed to see on reports? Moving to Analysis Services, you’ll find that the model can apply security on connect. I wrote more about this in my article Protect UDM with Dimension Data Security.

  7. Isolation

Because an analytical layer sits on top of the relational database, it provides a natural separation between reports and data. For example, assuming distributed deployment, a long-running ETL job in the database won’t impact the performance of the reports serviced by the analytical layer.

VertiPaq Rebranded as xVelocity

Apparently, the name “VertiPaq” wasn’t catchy enough so Microsoft rebranded it as xVelocity (probably got tipped by Comcast). This is just a name change, no new features.

Glossary

xVelocity: The SQL Server family of technologies that utilize in-memory columnar storage to achieve very high-performance in query processing.

1.   xVelocity for Business Intelligence
Introduced as VertiPaq in the SQL Server 2008 R2 release, this in-memory columnar storage technology is the analytical engine that powered PowerPivot in that release, and is now in both PowerPivot and SQL Server Analysis Services in Tabular mode for the SQL Server 2012 release. xVelocity for BI consists of:

  • xVelocity In-memory Analytics Engine in SSAS 2012 Tabular Mode (used for enterprise-grade, scalable BI)
  • xVelocity In-memory Analytics Engine (previously called Vertipaq) in PowerPivot (used for self-service and team-oriented BI scenarios), available in PowerPivot for Excel and SharePoint Server


2.   xVelocity for Data Warehousing
Memory-optimized columnar (columnstore) index technology for use with SQL Server Data Warehouses. Data is stored in column-wise fashion that can be used to answer a query just like data in any other type of index. A columnstore index appears as an index on a table when examining catalog views or the Object Explorer in Management Studio. The query optimizer considers the columnstore index as a data source for accessing data just like it considers other indexes when creating a query plan.

Exceptions

In cases where the VertiPaq name appears in the product (VertiPaqpagingpolicy parameter, VertiPaq SE event, etc.), please continue to use VertiPaq, or xVelocity (VertiPaq) if necessary to avoid confusion.

Happy New Year 2012!

As 2011 is winding down, it’s time to reflect on the past and plan for the future. 2011 has been a very exciting year for Microsoft BI and me.

  1. Gartner positioned Microsoft as a leader in the 2011 Magic Quadrant for Business Intelligence Platforms.
  2. Although SQL Server 2012 will technically ship early next year, we can say it’s a done deal as it’s currently in a release candidate phase. The most important news from a BI perspective is the evolution of the Business Intelligence Semantic Model (BISM), which an umbrella name for both Multidimensional and Tabular models.
  3. The Tabular model provides us with a nice personal (PowerPivot for Excel)-team (PowerPivot for SharePoint)-organizational (Analysis Services Tabular) continuum on a single platform.
  4. Power View extends the BI reporting toolset with a sleek web-based reporting tool for authoring highly interactive and presentation-ready reports.
  5. In its second release, Master Data Services (MDS) comes out of age and now allows end users to use Excel to manage master data. The newcomer, Data Quality Services (DQS), complements MDS nicely in the never-ending pursuit for clean and trusted data. Integration Services has also nice enhancements. Finally, columnstore indexes will help to aggregate large datasets, such as the scenario I mentioned in this blog.

Looking forward to 2012 and beyond, here is my top 5 BI wish list:

  1. Extending the Tabular capabilities with more professional features, such as scope assignments, role-playing dimensions, MDX query support, and so on, to enhance its reach further in the corporate space. Ideally, I expect at some point in future unification of Multidimensional and Tabular so BI pros don’t have to choose a model.
  2. Extending Power View to support multidimensional cubes. Further, in the reporting area, I expect an embeddable web-based OLAP browser (it’s time for Dundas Chart to come back to live) and an improved MDX query designer (no, I haven’t lost hope for this one).
  3. Enhanced Excel BI capabilities so Excel becomes the BI tool of choice. This includes supporting PowerPivot natively and overhauling the reporting capabilities beyond the venerable PivotTable and PivotChart. Ideally, what I am hoping for is decoupling Power View from SharePoint and integrating it with Excel and custom web applications. Power View is too cool to be confined onlyin SharePoint.
  4. Extending Microsoft Azure with BI capabilities to let solution providers host BI models in the cloud.
  5. Bringing BI to mobile devices.

On the personal side of things, I’ve been fortunate to stay healthy and busy (very busy). The Atlanta BI group, which I am leading, has grown in size and we now enjoy having 40-50 people attending our monthly meetings. For the past few months, I’ve been working on my next book, Applied Microsoft SQL Server 2012 Analysis Services (Tabular Modeling), which I expect to get published in March. And, my consulting business has been great!

I wish you a healthy and prosperous year! I hope to meet many of you in 2012. Meanwhile, you can find me online at the usual places: www.prologika.com | blog | linkedin | twitter.

Happy New Year!

SQL Server DENALI CTP3 Demo VHD Available

Microsoft just released a Hyper-V image of SQL Server Denali CTP3 in action, including fully configured services and integration with SharePoint 2010 and Office 2010. The following software is configured on the virtual machine:

• SQL Server “Denali” CTP3

• SharePoint 2010

• Office 2010

PowerPivot and SQL Server Denali CTP3 Release Notes Available

Microsoft published release notes for PowerPivot and SQL Server Denali Community Technology Preview (CTP) 3 Release Notes. This means that the CTP3 release is imminent although the download link is not live yet. The release notes cover the new features pretty well.

UPDATE 7/12/2011

CTP3 got released today.

Business Intelligence Semantic Model – TechEd Redux

While I’ve been busy at TechEd talking to BI enthusiasts, professionals and wannabes and delivering sessions, the news is out about the new BI roadmap and BISM positioning. See:

  • T.K. Anand blog
  • T.K. Anand & Ashvini Sharma recorded session What’s New in Microsoft SQL Server Code-Named “Denali” for SQL Server Analysis Services and PowerPivot”?
  • Sean Boon, Carolyn Chao, and Sabrena McBride recorded session Abundantly “Crescent”: Demos Galore
  • Julie Strauss’ recorded session The Next Generation Design Tools for Analysis Services
  • And the feedback from the community insiders, including Chris Webb’s Good News on the Future of Analysis Services blog, Marco Russo’s Microsoft Updates its BI Roadmap blog, and Boyan Penev’s SSAS to BISM – Recent Developments blog.

So, I won’t repeat what’s been already said. Instead, I’ll attempt to summarize my thoughts about the new BI developments and give you some take-home points to help you plan future BI work.

  • I spent many hours with the SSAS and SSRS product groups at TechEd. I liked what I saw. I saw the SSRS and SSAS teams working together. I saw the impressive visualization capabilities of the sleek Crescent tool which will give the competition a run for their money. And I saw the future of Analysis Services and Microsoft BI platform – the new BISM model that is positioned to become what UDM promised to be.
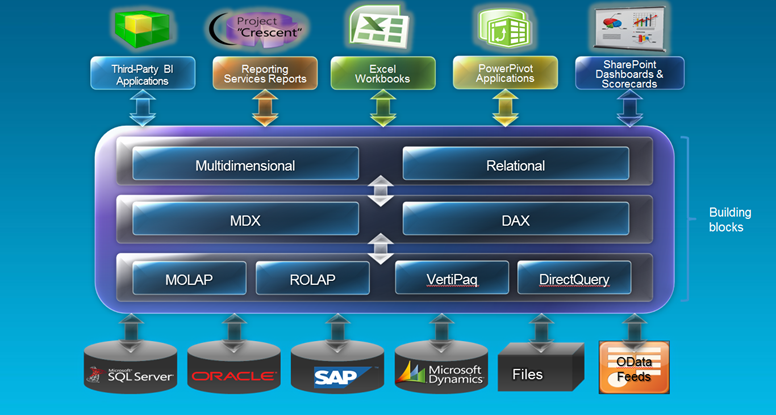
  • BISM is now the unifying name for both the Multidimensional (OLAP) and Tabular or Relational (in-memory) models. Both models will support MDX and DAX query options. Consequently, Excel can see a tabular model as a cube and query it with MDX, while Crescent will be able to see an OLAP cube as a tabular model and send DAX queries to it. This is awesome news that warrants retreating the Ugly part from my blog Business Intelligence Semantic Model – The Good, The Bad, and the Ugly. Kudos to Microsoft for listening to the community and kudos to MVPs for providing relentless feedback!
  • Make no mistake though. Although the external interfaces are the same and there is a significant feature overlap, in Denali the two models will not compatible with each other and no migration path will be provided, e.g. OLAP to Tabular or vice versa. An analogy might be helpful here. Think of Microsoft Access and SQL Server relational databases. Both of them are databases, both support SQL, and both have similar features (tables, relationships, etc.). We could use the label “Relational Database Model” as a unifying name for both databases although each path leads to a completely different model. So, why we are implying a unification here? Think of BISM as a prediction of the future. In time, Tabular may “borrow” OLAP features, such as MDX scripts and OLAP may get Tabular’s elements, such as in-memory partitions. Thus, the divide between the models might blur to a point where the two paths converge into a single model.
  • The most important thing to remember is that the Tabular model is not a replacement for OLAP cubes. Anybody and I repeat anybody, who claims the opposite should be brought to justice and tried in the BI Court. T.K. Anand from the Microsoft SSAS team has actually a faster procedure of strangling that person with his bare hands. You should see Tabular as completing and not competing technology to OLAP, a technology that opens interesting possibilities that were not previously possible with OLAP alone.
  • Regardless of naming and marketing, the question in everybody’s mind moving to Denali would be which path and model to choose for new projects. And, here is my simplified personal plan based on the type of the BI project at hand:

    Self-service BI – This is a no-brainer – PowerPivot and Excel. If you want to let business users analyze data on their own, look no further than Excel.

    Team BI – How do business users share PowerPivot models with other users? SharePoint and PowerPivot of course. Another no-brainer.

    Corporate BI – This is where things get trickier. Let’s go through a few scenarios:

  1. If you’ve started on the PowerPivot path but have exceeded the PowerPivot capabilities, e.g. you need more data (above 2GB) or row-level security, then a PowerPivot model migrated to Analysis Services running in a VertiPaq mode will be a logical choice. This will give you a nice continuum of self-service BI – Corporate BI on a single platform.
  2. If all you need is a simple model that wraps a layer over a raw database or warehouse for reporting & analytics and you don’t have experience with OLAP, consider a tabular model and DAX because of its lower learning curve and less rigid data schema requirements. The issue I have with the “simple” model is that based on my experience many projects start simple but grow exponentially in complexity over time. A many-to-many relationship may creep in, as well as time calculations, currency conversion, etc. So, be careful here, evaluate requirements (if you have them) and take your time to weigh out features and prototype because switching from one model to another will require a complete rewrite. Continuing the Relational Database analogy above, it will feel like moving from Access to SQL Server and you won’t have a wizard. Denali Tabular won’t support OLAP features that we grew to love, such as declarative parent-child and many-to-many relationships (it does support them via DAX calculations but you’ll end up with a calculated measure for each numeric column as in the SSAS 2000 days), scope assignments for implementing time calculations, allocations and currency conversion, Excel what-if analysis, default members, named sets, and others. Although easy to start with, DAX calculations can become complex to a point where you might wonder what you are really saving by switching from MDX to DAX if you are after avoiding the MDX learning curve.
  3. Enterprise-wide BI and Data Warehousing – Here, I’d stick with multidimensional OLAP cubes for now. I won’t bet complex and high-visibility projects on Tabular, at least not for Denali. First, more than likely such projects will require the features I mentioned above. Second, I’d give Tabular some time to marinate in the corporate space. Finally, in Denali only Crescent will support Tabular natively via DAX. In comparison, there are many clients that are optimized to support MDX and OLAP cubes.

I’d like to indulge myself and think that one day, I hope in not so distant future, BISM will evolve to become a true single model that delivers on the UDM promise and combines the best of OLAP and Tabular. Then, we would be able to pick and mix features from both OLAP and in-memory paths, e.g. an in-memory storage with MDX calculations, and use the best technology for the task at hand. Until then, we will have to choose between the multidimensional and tabular paths.

052011_0128_BusinessInt1

Project Barcelona

After dropping the Microsoft Business Intelligence Indexing Connector, Microsoft is working on an advanced content crawler, code-named Project Barcelona, that will index BI content, such as SQL Server, Excel, SharePoint, Reporting Services, Analysis Services, SSIS. Although initially aimed at DBA/ETL developers, its ambitions go well beyond that. According to the team blog, “At the end of the day, we want to build a set of tools that makes managing the modern enterprise data topology significantly easier – so we strongly believe we will need significant feedback before landing on the right design and feature set”. The blog doesn’t say when Barcelona will be released and how it will be implemented. I’d expect it to become a part of SharePoint and released alongside SQL 11 but this is just a speculation on my part.

More Details about BISM (UDM 2.0)

It looks like this year SQL PASS was the one to go. A must read blog from Chris Webb who apparently shares the same feelings and emotions about the seismic change in Analysis Services 11 as I do. A must read…

More Dundas Components Move to Microsoft

Now, this is great news for Microsoft BI and .NET developers. As announced on the Dundas website, the agreement between Dundas and Microsoft, which allows Dundas to continue sell, enhance, update and support its components, will expire on October 31, 2010. Subsequently, all components change hands and become a Microsoft intellectual property. These components are:

  • Dundas Chart for ASP.NET (Professional and Enterprise), Dundas Chart for Window Forms (Professional and Enterprise), Dundas Chart for SharePoint, Dundas Chart for SQL Server Reporting Services, Dundas Chart for OLAP Services
  • Dundas Gauge for ASP.NET, Dundas Gauge for Windows Forms, Dundas Gauge for SharePoint, Dundas Gauge for SQL Server Reporting Services
  • Dundas Map for ASP.NET, Dundas Map for Windows Forms, Dundas Map for SQL Server Reporting Services
  • Dundas Calendar for SQL Server Reporting Services

For me, the most interesting of these is the Dundas Chart for OLAP Services. If you have followed my blog, you know that I’ve been complaining on a regular basis that after retiring OWC, Microsoft didn’t provide any suitable web-based OLAP browser. In fact, this ranked 3rd on my SSAS wish list last year. Although I won’t get a Silverlight-based control anytime soon, I’ve used the Dundas Chart for OLAP Services (AJAX-based) in my projects and I can say great things about it. It lets you add OLAP browsing features to ASP.NET applications very easily. The Dundas Calendar will be a good addition to SSRS and .NET as well.

At this point, it’s not clear how which Microsoft products will acquire which components. Most of them (excluding probably the SSRS counterparts) will get added to Visual Studio. I can’t wait this to happen…

So, what will Dundas do after the transition? The Dundas Dashboard – now in version 2.0, with 2.5 coming up soon. More about the Dundas Dashboard will be coming up …. stay tuned.

UPDATE 10/22/2010

To clarify, Microsoft acquired the intellectual property rights from Dundas back in 2007. At the end of October, Dundas will stop selling these components that they were reselling from Microsoft since the acquisition. Dundas will continue to support them through October 31, 2011 for existing customers with support agreements. Integrating the “orphaned” components into Microsoft offerings is on the Microsoft TODO list.