There is still time to register for the online Applied Analysis Services 2008 class run on May 17th. No travel, no hotel expenses, just 100% content delivered right to your desktop! This intensive 3-day online class (14 training hours) teaches you the knowledge and skills to master Analysis Services to its fullest. Use the opportunity to ask questions and learn best practices.
This is a review of the latest addition to the long repertoire of Reporting Services books – Microsoft SQL Server Reporting Services Recipes (ISBN: 978-0-470-56311-3). When you learn a new technology you suggest you pick up several books covering this product because every author writes from his own experience. Thus, even books covering the same technology are not competing by completing each other. Some books target novice users, others are more advanced; some have a strong practical connotation while others are designed to be used more as a reference.
In my opinion, this book will benefit mainly readers who have worked with Reporting Services and have already some report authoring experience under their belt. If you fit this profile, you probably find yourself occasionally wanting a report sample that addresses a specific requirement, a tip for better implementation, or a trick to get around a given limitation. Continuing this line of thought, another title for this book might have been “Reporting Services Tips and Tricks”.
Two author names appear on the book cover – Paul Turley and Robert Bruckner – and both names should be familiar to you. Both authors have been heavily involved with Reporting Services since its inception. Paul is a SQL Server MVP and BI architect for Hitachi Consulting. Robert is a technical lead with the Reporting Services team and when he speaks I take a note. Both authors have helped the community tremendously by answering questions on the Reporting Services discussion list, writing and blogging about Reporting Services, and speaking at industry events. Some of the book material has been contributed by other Hitachi employees and SQL Server experts. The foreword is written by Thierry D’hers – Group Program Manager with the Reporting Services team.
The good thing about this book is that it’s not tied to a particular release of Reporting Services. What I particularly liked is that in some cases the authors have provided examples that work with previous editions of Reporting Services, coupled with versions that benefit from the latest features found in 2008 or R2. The book is organized in the following parts:
Introduction (80 pages) – Provides the necessary foundation for report authoring.
Part 1: Columnar and Grouped Reports (50 pages) – This part covers features that every report author should know, including alternative row colors, dynamic groups, conditional column visibility, and resetting page numbers.
Part 2 : BI Dashboards and Elements (30 pages) – This is where you would learn to work with indicators, sparklines, charts, and other elements to author dashboard pages that are becoming increasingly popular. You will also learn interesting tips to integrate your reports with Analysis Services.
Part 3: Chart and Gauge Reports (60 pages) – Think of this part as how to get the most out of the Reporting Services data visualization features. It walks you through the cornucopia of chart types that SSRS 2008 made possible, such as histogram, Peretto, bullet graphs, and gauges. It teaches you how to enhance these charts with custom color palettes and exception highlighting.
Part 4: Interactive Reporting (40 pages) – Reporting Services has supported interactive features since the beginning, such as drillthrough, toggled visibility, links, bookmarks, etc. This part takes the interactive features to the next level by showing you how to implement conditional linking, breadcrumbs, dynamic pivoting and document maps.
Part 5: Integrated Reporting Applications (35 pages) – This part shows you how to build report solutions that go beyond a single report, such as conditional subreports, changing the data behind the report, and embedding reports in .NET applications.
Part 6: Enhanced Report Content (100 pages) – This part covers advanced report authoring techniques, including mailing labels, barcodes, custom aggregation, dynamic page breaks, external images, checkbox list and mapping (a new feature of R2).
Part 7: Filtering and Parameterization (70 pages) – Report parameters is one area that takes a lot of criticism from the community and it’s one of the weakest links of Reporting Services. The authors present several workarounds for common requirements and limitations, such as advanced filtering, handing multi-valued parameters, top ranking, and custom sorting.
Part 8: Custom and Dynamic Data Sources (30 pages) – This section shows advanced techniques for data retrieval, such as obtaining data from a web service, SharePoint lists (2008 and R2), and Dynamics AX.
Part 9: Games (15 pages) – Now that you’ve learned all these cool tricks, it’s time to chill out. If Xbox is not cool anymore, Reporting Services is here for you to play and delight your users with games such as hangman, and sea battle. Hallo is coming soon… just kidding.
In a nutshell, pick up this book. You’ll find yourself reaching for it on a regular basis.
https://prologika.com/wp-content/uploads/2016/01/logo.png00Prologika - Teo Lachevhttps://prologika.com/wp-content/uploads/2016/01/logo.pngPrologika - Teo Lachev2010-05-01 21:33:002016-02-17 05:42:05Book Review – Microsoft SQL Server Reporting Services Recipes
Microsoft announced release dates for SQL Server R2, SharePoint 2010, Office 2010, and Visual Studio 2010.
According to the Microsoft SQL Server Team Blog: SQL Server 2008 R2 (aka SQL 2010) will be listed on Microsoft’s May price list, and will be available by May 2010
According the Microsoft SharePoint Team Blog: SharePoint 2010 and Office 2010 will be officially launched on May 12, 2010 with an RTM date of April 2010
Visual Studio 2010’s release date was pushed to April 12, 2010 due to some performance issues according to Developer Division’s Marketing and Communications Manager Rob Caron’s blog.
Now that I’ve got my copy and read it, I can say a few things about the book Expert Cube Development with Microsoft SQL Server 2008 Analysis Services by Chris Webb, Alberto Ferrari, and Marco Russo. As mentioned in another post, the authors (all MVPs and prominent SSAS experts) don’t disappoint and you won’t go wrong picking up this book. The book is somewhat small in size (330 pages) but big in wisdom and best practices. It also includes plenty of references to external resources and blogs that the authors and other SSAS experts have written when you need further understanding of the topics discussed. Make no mistake though, this is not a step-by-step book and it doesn’t target novice users. As its title suggests, the book is geared toward more advanced users who have a few years of SSAS experience under their belt and are thirsty for more insightful knowledge.
Chapter 1 Designing the Data Warehouse for Analysis Services
The first and most important step for implementing a successful Analysis Services solution has nothing to do with Analysis Services at all. Its success depends on a solid schema design on which you’ll build the cube so the book is right on target to hit this topic first. Chapter 1 discusses common schema modeling challenges and provides plenty of tips to tackle them. One grudge I have here is about the following sentence “Beware of the temptation to avoid building a data warehouse and data marts” which may leave the reader with the impression that a data mart is a must. In fact, call me lazy but the first thing that I’d explore when starting a new SSAS project is if it’s possible to avoid a separate database. While a classic OLAP solution in many cases will require a new database (whatever you call it a data warehouse or a data mart) and the whole ETL enchilada that this entails, you may need to build a cube on top of simpler schemas, such on top of a DSS (decision support system) schema. In this case, I would explore the option to “dimensionalize” the source schema with a layer of SQL views. As with everything else, the keep-it-simple principle works for me.
Chapter 2 Basic Dimensions and Cubes
This chapter discusses the groundwork required to set up the raw dimensional model. This includes working with data sources, data source views, cubes, and dimensions. My favorite part of this chapter was the attribute design and setting up attribute relations. This often overlooked aspect of SSAS development is crucial for achieving good performance and the book explains why.
Chapter 3 Designing More Complex Dimensions
Next, the book explains how to handle more complex dimension schemas and hierarchies. This includes parent-child, ragged, slowly-changing, referenced, fact, and junk dimensions. The authors’ real-life experience shows through. About junk dimensions, my preference is to avoid them wherever possible for performance reasons. Instead, I’d explore the option to keep the low-cardinality attributes in the fact table and use report or URL actions to view them. In my opinion, SSAS is not there yet as far as reporting on details.
Chapter 4 Measures and Measure Groups
The whole purpose of building a cube is to aggregate measures. Analysis Services supports various aggregation functions and the book provides essential coverage. You will learn how to implement semi-additive measures if you cannot afford the Enterprise Edition of SQL Server. Custom aggregation by using unary operators and custom member formulas are presented too. Then the book discusses more complex relationship types, including different grains, linked dimensions and measure groups, role-playing dimensions and fact relationships.
Chapter 5 Adding Transactional Data
Although most users would be interested in aggregated data, sometimes users may need to see the level of details behind a cell. The book explains how you can do this by using drillthrough and actions. Drillthrough options are covered in great details. Excellent coverage is provided for many-to-many relationships as well.
Chapter 6 Adding Calculations to the Cube
Cubes usually include business calculations in the form of MDX expressions. Chapter 6 gives lays the foundation for using MDX. It provides practical examples for calculated members, including YTD, ratios, growths, same period last previous year, moving averages, and ranks. Handling relative dates is a common business requirement. For example, I personally had to implement two custom types of relative dates as explained in this blog. The book provides a great example for implementing a custom calculation dimension for implementing more flexible relative dates that the BI Wizard provides. Finally, the chapter discusses static and dynamic named sets.
Chapter 7 Adding Currency Conversion
I consider myself lucky for never having to support international users because of the complexities surrounding the issue. If you have to, SSAS gives you the necessary features to tackle various localization requirements. This chapter walks you through the details of implementing currency conversion using the BI wizard, measure expressions, and writeback. My advice is to avoid writeback due to its limitations. Instead, consider an URL action that navigates the user to a custom web page for handing data changes and proactive caching for automatically updating the cube.
Chapter 8 Query Performance Tuning
SSAS bends backwards to provide great performance. You can help by following best practices for cube design. This chapter teaches you how to implement partitions and aggregations. I like the sections for monitoring partition and aggregation usage and building aggregations manually. The chapter presents useful tips to diagnose and resolve performance issues, such as by using the MDX Studio, named sets, calculated members, and caching.
Chapter 9 Securing the Cube
Chances are you will need to provide restricted access to the cube for groups of users. This chapter shows you how to implement and test roles. It covers cell and dimension security. It presents solutions for implementing custom dimension data security which are similar to the ones I discussed in this article.
Chapter 9 Productionization
Your SSAS solution is ready and it’s time to see daylight. This chapter covers the tasks associated with deploying and managing your SSAS solution in production environment. These include managing and generating partitions and processing. I liked the coverage of different processing options.
Chapter 10 Monitoring Cube Performance and Usage
As an administrator, your job doesn’t end once the solution is deployed. You need to monitor it on a daily basis to ensure that it performs optimally. The last chapter explains different server monitoring techniques, such as performance counters, tracing, Resource Monitor, SQL Profiler, and using Dynamic Management Views (DMVs). I personally liked the memory management tips.
In summary, I highly recommend this book to anyone who has several years of experience in SSAS development and need a compass check to make sure that he follows the right track. Kudos to the authors for taking time to write it!
https://prologika.com/wp-content/uploads/2016/01/logo.png00Prologika - Teo Lachevhttps://prologika.com/wp-content/uploads/2016/01/logo.pngPrologika - Teo Lachev2009-12-02 14:00:002016-02-17 06:36:08Expert Cube Development with Analysis Services 2008
We are excited to announce the availability of an online Analysis Services 2008 class – no travel, no hotel expenses, just 100% content delivered right to your desktop! This intensive 3-day online class (14 training hours) is designed to help you become proficient with Analysis Services 2008 and acquire the necessary skills to implement OLAP and data mining solutions. Learn how to build an Adventure Works cube from scratch. Use the opportunity to ask questions and study best practices..
Applied Analysis Services 2008 Online Training Class
with Teo Lachev
Date: November 16 – November 18, 2009
Time: Noon – 4:30 pm EDT; 9 am – 1:30 pm PDT
14 training hours total for only $799!
Attend this class for only $799 and get a free unrestricted e-book copy of the book Applied Analysis Services 2005 by Teo Lachev!
For more information or to register click here!
https://prologika.com/wp-content/uploads/2016/01/logo.png00Prologika - Teo Lachevhttps://prologika.com/wp-content/uploads/2016/01/logo.pngPrologika - Teo Lachev2009-10-24 22:54:002021-02-16 03:45:35Applied Analysis Services 2008 Online Training Class with Teo Lachev
After retiring Office Web Components (OWC), which can hardly can pass the web test as it is implemented as an ActiveX control, Microsoft left developers with no web-based browser for Analysis Services. True, for those who can afford the hefty price tag, Microsoft Office SharePoint Server (MOSS) supports server-side Excel spreadsheets that render to HTML. However, while Excel rules the Windows-based OLAP browser space, HTML-based Excel spreadsheets with limited filtering can hardly meet the demand for web-based interactive reporting. Then, there is an option to author Reporting Services OLAP reports but outside limited interactive features their layout is pretty much fixed at design time.
What’s really needed is a Silverlight Analysis Services control that ships with Visual to let developers embed an Excel-like Analysis Services browser into their ASP.NET applications. You need this control and I need it but it’s not coming anytime soon. Meanwhile, third-party vendors rush in to fill the gap.
In a recent project, we used Dundas OLAP Chart for Analysis Services, which I mentioned in one of my previous blogs. Dundas has just released version 7 of this control and I really like what I see. It’s currently the best OLAP-based chart in the industry. The Dundas OLAP Chart for Analysis Services is a regular ASP.NET control with AJAX features for improved user experience. With Silverlight establishing as the web platform of choice for web developers, you may be looking for a Silverlight-based Analysis Services browser. This is where the Intelligencia for Silverlight comes in.
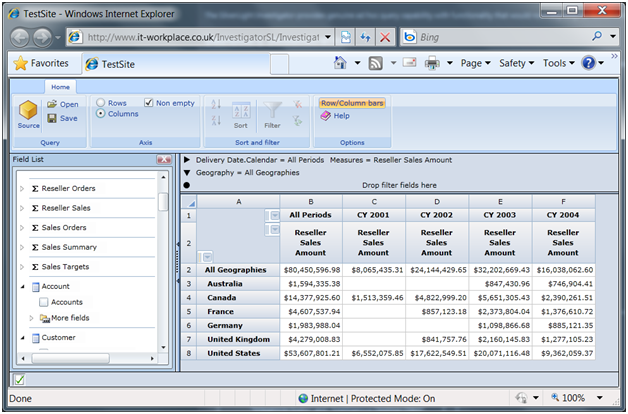
I blogged about Intelligencia for Reporting Services before and pointed out where I think it surpasses the MDX Query Designer included in Reporting Services. What IT-Workplace has done this time is bringing their product to the web and it has wisely decided to use Silverlight. The moment I saw the new version, it grabbed my attention. Users familiar with Excel PivotTable reports would find the Intelligenca metadata pane (Field List) very similar. Users can create a report by dragging and dropping objects to the report pane on the right. Actually, I would love to see IT-Workplace adding the Filter, Columns, Rows and Filter panes below it just like Excel. I’d welcome also in-place filtering just like Excel. You got the idea. For me and my users, the more Excel-like the browser is the better. This lowers the learning curve and unifies the desktop vs. web experience.
But Intelligencia for Silverlight is more ambitious than just bringing Excel-like reporting to the web. The control has scriptable interface and a filter control which allows management dashboards to be created by linking grids and filters, as the first link on the web page demonstrates.
In summary, while still rough around the edges (it’s currently in a beta phase), I think Intelligencia for Silverlight has a lot of potential and is positioned to fill in a wide gap left by Microsoft by letting web developers embed an Analysis Services OLAP browser in their applications. Powered by Silverlight, Intelligencia for Silverlight could bring Excel PivotTables to the web. Visit the Intelligencia for Silverlight web page, download and test the control, and provide feedback to improve the control
Today was a long day. I started by attending the Richard Tkachuk’s A First Look at Large-Scale Data Warehousing in Microsoft SQL Server Code Name “Madison”. Those of you familiar with Analysis Services would probably recognize the presenter’s name since Richard came from the Analysis Services team and maintains the www.sqlservernanalysisservices.com website. He recently moved to the Madison team. Madison is a new product and it’s based on a product by DATAllegro which Microsoft acquired sometime ago. As the session name suggests, it’s all about large scale databases, such as those exceeding 1 terabyte of data. Now, this is enormous amount of data that not many companies will ever amass. I’ve been fortunate (or unfortunate) that I never had to deal with such data volumes. If you do, then you may want to take a look at Madison. It’s designed to maximize sequential querying of data by employing a shared-nothing architecture where each processor core is given dedicated resources, such as a table partition. A controller node orchestrates the query execution. For example, if a query spans several tables, the controller node parses the query to understand where the data is located. Then, it forwards the query to each computing node that handles the required resources. The computing nodes are clustered in a SQL Server 2008 fail-over cluster which runs on Windows Server 2008. The tool provides a management dashboard where the administrator can see the utilization of each computing node.
Next, I attended the Fifth Annual Power Hour session. As its name suggests, TechEd has been carrying out this session for the past five years. The session format was originally introduced by Bill Baker who’s not longer with Microsoft. If you ever attended one of these sessions, you know the format. Product managers from all BI teams (Ofice, SharePoint, PerformancePoint, and SQL Server) show bizarre demos and throw t-shirt and toys to everything that moves (OK, sits). The Office team showed an Excel Services demo where an Excel spreadsheet ranked popular comics characters. Not to be outdone, the PerformancePoint team showed a pixel-based image on Mona Lisa. Not sure what PerformancePoint capabilities this demonstrated since I don’t know PerformancePoint that well but it looked great.
The Reporting Services team showed a cool demo where the WinForms ReportViewer control would render a clickable map (the map control will debut in SQL Server 2008 R2) that re-assigns the number of Microsoft sales employees around the US states. For me, the coolest part of this demo was that there was no visible refresh when the map image is clicked although there was probably round tripping between the control and the server. Thierry D’Hers later on clued me in that there is some kind of buffering going on which I have to learn more about. This map control looks cool! Once I get my hands on it with some tweaking maybe I’ll be able to configure it as a heat map that is not geospatial.
Finally, Donald Farmer showed another Gemini demo which helped learn more about Gemini. I realized that 20 mil+ rows were compressed to 200 MB Excel file. However, the level of compression really depends on the data loaded in Excel. Specifically, it depends on the redundant values in each column. I learned that the in-memory model that is constructed in Excel is implemented as in-process DLL whose code was derived from the Analysis Services code base. The speed of the in-memory model is phenomenal! 20 mil rows sorted within a second on the Donald’s notebook (not even laptop, mind you). At this point Microsoft hasn’t decided yet how Gemini will be licensed and priced.
As usual, after lunch I decided to hang around in the BI learning center and help with questions. Then, it was a show time for my presentation! I don’t why but every TechEd I get one of these rooms that I feel intimidated just to look at them. How come Microsoft presenters who demo cooler stuff than mine, such as features in the next version, get smaller rooms and I get those monstrous rooms? It must be intentional; I have to ask the TechEd organizers. The room I got was next to the keynote hall and could easily accommodate 500-600 people, if not more. Two years ago, I actually had a record of 500+ people attending my session which was scheduled right after the keynote.
This year, the attendance was more modest. I don’t have the final count yet, but I think about 150+ folks attended my session so there was plenty of room to scale up. I think the presentation well very well. The preliminary evaluation reports confirm this. I demoed report authoring, management, and delivery tips sprinkled with real-life examples. We had some good time and I think everyone enjoyed the show.
It’s always good to know that your work is done. I look forward to enjoying the rest of TechED and LA.
https://prologika.com/wp-content/uploads/2016/01/logo.png00Prologika - Teo Lachevhttps://prologika.com/wp-content/uploads/2016/01/logo.pngPrologika - Teo Lachev2009-05-14 04:51:002021-02-16 03:45:15Transmissions from TechEd USA 2009 (Day 3)
Day 1 of TechEd 2009 is almost over with the exception of the Community Influencers Party tonight. I heard that this year they expect 7,000 attendees. This is a huge scale-down from previous years. For instance, we had 16,000 attendees at TechEd USA 2007. Economy is hitting everything hard.
I thought the keynote was kind of lame. Judging by it, Microsoft has only three products: Windows 7 (officially announced to ship around holidays although Microsoft didn’t say which holidays), Windows Server 2008 (the buzz is now the forthcoming R2 release), and Exchange Server 2010. Unlike previous TechEds, there wasn’t a single announcement about other products. SQL Server KJ, Office 2010, Azure, dev tools? Nope, apparently not worth mentioning. Sure Mark Russinovich, whom I respect very much, did some cool Windows 7 demos but there were not enough to pique my interest. I understand that OS and Exchange Server are bedrock for every business and after the sad Vista saga, we have to show the world that now we’ll do things right with Windows 7, but the BI soul in me was thirsty for more.
After lunch, I hang around the BI area of the Learning Center, where I answered questions and met with other peers, including Nick Barclay (MVP) whom I wanted to meet personally for a while. Then, I attended the excellent Donald Farmer and Kamal Hathi ‘s Microsoft Project Code Name “Gemini: Self Service Analysis and the Future of BI and I had the chance to see the Gemini, which I blogged briefly about before without knowing too much, for the first time in action and gain more in-depth knowledge.
The Gemini is an end-user oriented Excel add-in that will let the user acquire data from a variety of data sources, including SSRS reports (SSRS KJ will expose reports as data feeds) and SharePoint lists, and load them in an Excel spreadsheet. The tool crunches data very fast even on a modest computer (the demo showed a notebook computer working with millions of rows) thanks to its ability to compress column-level data. This works because a dataset column would typically contain redundant data.
Once data is loaded in Excel, the tool will attempt to automatically determine the relationships between datasets (loaded in separate spreadsheets) to create a hidden dimensional model consisting of fact and dimension in-memory tables. The user will be able to manually specify the dataset relationships by telling the tool which column will be used to join the datasets (very much like joining relational tables). Moreover, the user will be able to define calculated columns using Excel-style formulas. Finally, as the add-in builds behind the scenes an in-memory cube, the user will be able to slice and dice data in a Pivot table report. So, no Analysis Services is needed if all the user wants is manipulating data on the desktop.
Where things are getting more interesting is deploying the models on the server. To do so, the end user would deploy the Excel spreadsheet to the MOSS Report Library. Note that MOSS is required for server-side deployment. When other users request the spreadsheet, an Analysis Services redirector will understand that this is a Gemini model and service the requests from a server cube. At this point is not clear how exactly the server cube will be built and whether it could be managed in SSMS. Once the cube returns data, Excel Services will kick in to return data in HTML. A Reporting Services client can also connect to the server cube by its URL. This is no different than connection to a regular cube as Reporting Services will launch the familiar MDX query designer.
So, where is the IT in the new Gemini world? IT will use a cool MOSS dashboard to understand who’s deployed what model and how the models are used, such as when the datasets were refreshed, what are the most popular models, what resources these models took on the server, etc.
What’s my personal take on Gemini? It’s not up to me to decide how useful it is since it’s a business-oriented tool, such as Report Builder 2.0. Business users will have the final word. Based on my personal experience though, the data analytics problems that I need to solve with traditional Analysis Services cubes surpass the Gemini capabilities by far. So, don’t throw your MDX knowledge out of the door yet. In my line of work, I can see Gemini being useful as a cube prototyping tool, especially in the early stages of requirement gathering where data can be typed in Excel and I can demonstrate to users what a cube can do for them. Of course, Microsoft plans for Gemini are much more ambitious than that. In the ideal world, all business users would upgrade to Office 2010 and create cool Gemini models to give IT folks a long-deserved break ;-). Or, so the fairytale goes….
To wrap up the day, I attended What’s New in Microsoft SQL Data Services presentation by Rick Negrin to find out that SQL Data Services is nothing more than SQL Server running on Microsoft data centers. SQL Data Services will support two application connectivity modes: a “code near” mode where the application (typically a web application) is deployed to Azure and “code far”, where the application will connect to SQL Server over Internet using the TDS protocol. Microsoft role is to provide scalability and failover. Not all SQL Server features will be available in version 1. For example, CLR will not make the cut.
A long and tiring day. I am off to the party now.
https://prologika.com/wp-content/uploads/2016/01/logo.png00Prologika - Teo Lachevhttps://prologika.com/wp-content/uploads/2016/01/logo.pngPrologika - Teo Lachev2009-05-12 03:33:002016-02-17 10:10:51Transmissions from TechEd USA 2009 (Day 1)
Today was supposed to be the birthday of the SQL Server 2008 Business Intelligence Development and Maintenance Toolkit by Microsoft Press but it’s not available with retailers, such as Amazon, yet. I guess a couple or so more days as the book is finding its way to resellers.
As with the 2005 version, I was privileged to work together with Erik Veerman and Dejan Sarka (all SQL Server MVPs) on the new revision. My part was the four Analysis Services chapters. Besides updating the book for SQL Server 2008, we re-worked the entire material to flow more logically and make this resource even more useful to help you prepare for the corresponding 70-448 exam.
I hope you’ll find the toolkit useful and pass the exam to certify!
https://prologika.com/wp-content/uploads/2016/01/logo.png00Prologika - Teo Lachevhttps://prologika.com/wp-content/uploads/2016/01/logo.pngPrologika - Teo Lachev2009-04-16 01:46:582021-02-16 03:45:12SQL Server 2008 Business Intelligence Development and Maintenance Toolkit Available
 Now that I’ve got my copy and read it, I can say a few things about the

 on the web page demonstrates.

