I’m optimizing a SQL Server OLTP mirrored database hosted on an Azure VM. After load testing, it was clear that CPU is the primary resource constraint so I suggested an upgrade to a higher A-series machine alongside other reconfiguration and storage changes. Meanwhile, I’ve noticed that starting in October, the D-Series pricing goes down. Moreover, D-series include a SSD temporary drive to host the temp database and buffer extensions. And, according to Microsoft, D-series have “60% faster processors than the A-series”. In this case, to save the customer money, I recommended a D-Series VM with less cores than the A-series VM upgrade I had in mind.
https://prologika.com/wp-content/uploads/2016/01/logo.png00Prologika - Teo Lachevhttps://prologika.com/wp-content/uploads/2016/01/logo.pngPrologika - Teo Lachev2015-09-21 12:35:002016-02-12 06:59:31Azure D-Series VM Prices Go Down
Scenario: You’re conducting a capacity planning effort and load testing an Azure website (Azure App Service) that saves data to SQL Server running on Azure VM. You’ve created a load test, e.g. using Visual Studio, and you’ve realized that the throughput caps for no obvious reason. SQL Server and Azure performance counters indicate that both layers are not under pressure.
Solution: Although no specifics are provided by Microsoft, it appears that Azure throttles user loads to prevent denial-of-service attacks. Based on my observations, Azure detects that the requests come from the same IP and caps the requests. As a workaround, consider conducting the load test using Visual Studio Online. Visual Studio Online allows you to distribute the test across multiple agents that can use different IP addresses (configurable as a test property). In our case, this allowed us to conduct successfully a stepped load test until we reached a performance bottleneck. Interestingly, in this case the bottleneck we first reached was CPU utilization on the front end even although we scaled it to three large Azure web instances. SQL Server was churning along just fine with a single data disk. You results might differ of course.
Microsoft just announced the public preview of Azure Data Catalog, previously known as “Project Tokyo”. I had a chance to take an early review of Azure Data Catalog to help a big organization which was interested in simplifying discoverability and access to data across the enterprise. As I mentioned in my “QUO VADIS DATA WAREHOUSE?” newsletter, logical data warehousing (LDW) has gained some traction and backing from vendors, including Composite (acquired by Cisco), Denado, and others.
“Logical data warehousing is at a very early stage of adoption. In my opinion, the companies that will benefit most of it are large organizations with many data repositories, where data availability is a major barrier for enabling self-service BI. If you believe that your organization might benefit from a Logical Data Warehouse, you might not need to make a major investment. If your organization has an Office 365 Power BI subscription, your first step could be leveraging the Power Query capabilities for dataset sharing and discovery. This process can work like this:
Designated users promote virtual views in the form of Power Query queries to Office 365.
A data steward verifies and approves these datasets.
Once signed in to Office 365, other users can search, preview these queries, and import the associated data in self-service BI models.”
You can view Azure Data Catalog is the Microsoft attempt to enter the logical data warehousing market. It also can be viewed as the next step of Power Query Dataset Sharing, now available as a standalone cloud service with new features. It’s all about providing and discovering the necessary metadata that describers the most valuable asset: your data. I welcome Azure Data Catalog but to make it more appealing to large organizations, which will be the most likely customers interested in it, I shared the following feedback with Microsoft:
Support more data sources, as it stands Azure Data Catalog is limited to SQL Server as RDBMS. It’s paramount to support initially at least the most popular ones, including Oracle, DB2, Hadoop, SalesForce, etc. In fact, I don’t see why we can support all Power Query-supported data sources if we route the data acquisition through Power Query.
Support for ODATA so that not only end users but applications can easily consume these shared datasets.
Support for in-memory dataset caching to allow the administrator to configure the datasets to cache results on the server. This could be conceptually similar to SSRS shared dataset caching. Caching would allow us to avoid hitting underlying databases for slow queries.
On-premise support – Cloud is great but it might be a hassle for a large organization to embrace the cloud if they haven’t done this already. Just extending their AD to the cloud would need to pass a lot of red tape.
Except this video, there isn’t much public information currently about Azure Data Catalog but that will probably change next week when Microsoft announces it officially.
https://prologika.com/wp-content/uploads/2016/01/logo.png00Prologika - Teo Lachevhttps://prologika.com/wp-content/uploads/2016/01/logo.pngPrologika - Teo Lachev2015-07-10 20:01:002016-02-12 08:00:29Azure Data Catalog Announced
I’ve been doing quite a bit of SQL Server performance work lately, helping customers embrace the cloud. One great feature of Windows Server 2012 and above is the ability to implement a storage pool combining multiple disks. This greatly simplifies disk striping to distribute I/O and deprecates RAID configurations, as explained in more details in the “Performance Guidance for SQL Server in Windows Azure Virtual Machines” whitepaper from Microsoft.
In this case, the client has an A7 Azure VM which allows attaching up to four 1TB data disks. Another great Azure feature is that you only pay for what you use. What it means to you is that you cut cost because you have all of this storage available but you are charged only for the actual storage and not for the capacity.
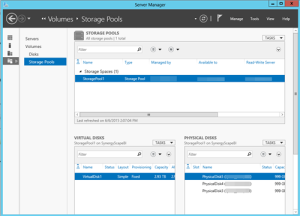
In the process of configuring the storage pool, you might find that none or some of the disks show up preventing you from creating a new storage pool although you’ve attached them all right and they are there. How do you fix this horrible issue? Delete the disk partitions (also known as volumes). That’s because you can only create a storage pool of uninitialized disks only.
Right Windows Disk Management.
Right-click on each disk and click Delete Volume.
Now you can create your storage pool. In this case, I’ve created one virtual disk that has three physical disks for a total combined storage of 3 TB.
https://prologika.com/wp-content/uploads/2016/01/logo.png00Prologika - Teo Lachevhttps://prologika.com/wp-content/uploads/2016/01/logo.pngPrologika - Teo Lachev2015-06-06 21:14:002021-02-16 04:59:34Where Are My Storage Pool Disks?
Data is your biggest asset and today’s currency but the data can be messy. You know it and we’ve seen it – many times. The messier the data, the bigger the headache. At Prologika, we believe that data quality issues should be addressed as early as possible and the validation process should start with the source systems. You need a solution to detect data entry issues without ETL, custom validation code, and exhaustively hard-coded rules. This is why I’m excited to announce today the availability of Prologika Validator!
Available as a cloud service and on-premises offering, Prologika Validator uses predictive analytics to find data anomalies in order to help you improve data quality. It analyzes historical data and discovers common data patterns and relationships. When the user attempts to save a data entry that is outside the norm, Prologika Validator can detect the outlier. Then, the source system can notify the operator about a potential data entry error. As a result, the data is cleaned at the source and wrong data doesn’t end up in downstream systems, such as a data warehouse. Suppose your company buys some products from vendors. The operator responsible for the order entry creates an order in the ERP system, such as Oracle Financials or Microsoft Dynamics. The system might not be capable of detecting a wrong field entry or a wrong combination of fields, such as the user has specified a wrong unit of measurement for the product purchased. However, Prologika Validator is capable of detecting such outliers by predicting the likelihood that the order entry is outside the norm. The validation process is very fast and the operator is notified immediately.
Sounds interesting? Visit the Prologika Validator page and give it a try now. If you want to know how Prologika Validator can help you improve data quality, contact us to discuss your requirements and get a pricing proposal.
In my previous blog on the Power BI subject, I’ve introduced you to Power BI. In this blog, we’ll take a look at the Data Management Gateway and how to set up data sources to refresh on-premise data. I’ll be quick to point out that the actual data refresh is not in the preview yet.
The Data Management Gateway is implemented as a Windows service which you can download and install on premises. It has two main features:
Enable cloud access for on-premises data sources within your organization
Expose data from on-premises data sources as OData feeds that can be consumed by using Power Query.
You configure the gateway and data sources from the Admin->Power BI section of the Office 365 portal. This starts a simple wizard that walks you through the steps to install, configure, and test the data management gateway. You can set up multiple gateways if needed, such as to bring data from two geographically separated servers.
Once the gateway is installed, you can configure one or more data sources that point to on-premise data, such as a relational database. In the Power BI context, a data source corresponds to a data connection, similar to the ones you set up in Power Pivot. In the configuration process, you specify a data source name, the gateway it’s associated to, and connectivity details. For now, the only connectivity option is to connect to SQL Server but Microsoft is extending the connectivity options with the goal to support all data sources that Power Pivot supports.
The Data Source Usage tab allows you to configure how the data source will be used. If the Enable Cloud Access option is checked, users can refresh Power Pivot workbooks with on-premise data. If Enable OData Feed is checked, the data source will be exposed as an OData feed in Power Query. Thus, the gateway functionality that allows you to expose SQL tables/views as OData endpoints could be used in non-Power BI ways. For example, you could access the OData feed from an Azure service (provided that your service/code supports Org ID authentication).For more information about the latter option is useful and how it can be used when available in the self-service/team BI context, read Access OData Feeds from Power Query Add-in for Excel.
A few more notes:
Currently, The Data Management Gateway is specific to Power BI. You can’t use it to upload data to the cloud for other purposes, such as a replacement for FTP. However, I won’t be surprised if Microsoft would eventually turn it into an Azure platform service.
As far as performance, assuming there are no bottlenecks on the data access side (i.e. running complex queries), in most cases the gateway performance will be a factor of your Internet speed between your corporate network and the Azure data center. To improve performance, the gateway compresses, chunks, and parallelizes the upload of the data. Microsoft will provide more details of how it all works at the PASS Summit (Power BI and the Data Management Gateway session).
For more information about the Power BI data management experience, read Data Management Experience in Power BI for Office 365 Help.
https://prologika.com/wp-content/uploads/2016/01/logo.png00Prologika - Teo Lachevhttps://prologika.com/wp-content/uploads/2016/01/logo.pngPrologika - Teo Lachev2013-09-10 12:50:002021-02-17 01:02:06Power BI (Part 2 – The Data Management Gateway)
Microsoft BI has been criticized about its complexity and price because it requires SharePoint Server Enterprise for deploying Power Pivot models and dashboards. Microsoft introduced Office 365 (E3 or E4 plan required) and SharePoint Online (Plan 2 required) to mitigate such concerns and allow you to host Power Pivot and Power View in the cloud. Power BI is the next step in the Microsoft BI cloud strategy. As I explained in a previous blog and in the SQL Server Team blog, Power BI is essentially a cloud combo of all the self-service “power” tools (Power Pivot, Power View, Power Query, and Power Map) available on a subscription basis and running on Microsoft Azure, precluding SharePoint on-premises installation and licensing.
Microsoft has started inviting participants subscribed to the Power BI for Office 365 Preview to test the prerelease version of Power BI. During the Worldwide Partner Conference, Amir Netz, a Technical Fellow at Microsoft, demonstrated some of the Power BI most exciting features. With the exception of Power View HTML5 preview, none of these features (on-premise data refresh, natural query, and InfoNavigator) are in the Preview yet. However, Microsoft is planning to refresh the Preview on a monthly basis and push these features as they become available. Pricing hasn’t been announced yet. One disappointing news for me is that for now Microsoft doesn’t plan to support the “mixed” scenario by connecting Power View to an on-premises semantic model (Multidimensional or Tabular). In other words, in its first release Power BI will be limited to supporting Power Pivot models only, excluding organizational BI capabilities both on cloud and on premises.
The setup experience is simple and it should be familiar to you if you’ve provisioned Office 365 in the past. The invitation letter includes links to the following resources to get you started with Power BI.
One provisioning step that you need to pay attention to is that you have to go to Users and Group section of the portal and assign yourself licenses to get access to the SharePoint sites.
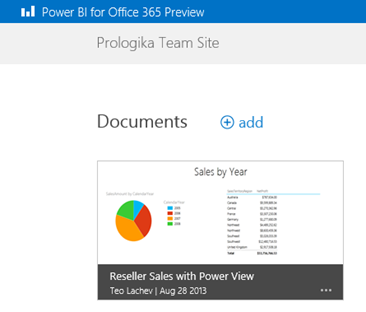
Once you’ve done this and navigate to the Sites and then Team Site, you’ll see a link to the Power BI site. The Power BI site supersedes Power Gallery. It’s the hosting site for deploying Power Pivot models for up to 250 MB in size.
Once you click deploy an Excel file with your Power Pivot model and reports, you can click it to render the reports in the browser. If the file includes a Power View report, Power BI would render it by default in Silverlight but gives you an option to try the new HTML5 preview by clicking the Try the Preview button in the bottom right corner, as explained in this blog. I ran into several issues during testing, including:
The Power BI site doesn’t always render
The Power View Field List doesn’t always show
The HTML5 preview generates empty rows. A list of the HTML5 supported features can be found here.
I believe that many organizations and ISVs will find Power BI attractive for cloud deployments of self-service and team BI solutions. Power BI mitigates concerns about on-premises SharePoint licensing, complexity, hardware and software overhead.
Expanding its Office 365 feature set, Microsoft introduced Power BI. Power BI is an umbrella name of the following BI offerings in the cloud: Power Pivot, PowerView, Power Query (previously known as Data Explorer), and Power Map (previously known as GeoFlow), plus more. Microsoft demonstrated Power BI at WPC yesterday (scroll to the 30th minute marker to see the Amir’s heart attack-provoking demo) or see the YouTube extract.
The “more” is the intriguing part to me:
Data Management Gateway – not sure how exactly this will work but it will provide some sort of connectivity to on-premise data so you can schedule PowerPivot data refreshes between the Microsoft cloud and your corporate data. Expect your ISP speed provider speed to be a limiting factor here so don’t hope for fast refreshes of millions of rows.
BI Sites – a dedicated SharePoint site that will support finding and collaborating on BI artifacts.
Mobile support – Power View is going HTML5!
Natural language query – Amir covered this interesting feature pretty well. I don’t know how it works behind the scenes yet (probably a natural language-to-DAX translator).
Data views – data stewards can publish datasets so they can be easily discoverable by Power Query.
King of the Hill – an interesting new PowerView visualization (demonstrated by Amir toward the end of the demo).
We don’t know at this point when these features will make to on-premise SharePoint, which probably would have been a better starting point for these enhancements. And, pricing hasn’t been announced yet. Look for Power BI toward the end of the summer if cloud self-service BI makes sense to your organization.
https://prologika.com/wp-content/uploads/2016/01/logo.png00Prologika - Teo Lachevhttps://prologika.com/wp-content/uploads/2016/01/logo.pngPrologika - Teo Lachev2013-07-09 23:28:002021-02-16 04:29:13Power BI Expands Microsoft Cloud Self-service BI
Microsoft announced today the availability of Windows Azure Infrastructure Services which is a collective name for running Virtual Machines and Virtual Networks in the cloud. Scott Guthrie’s blog on this subject is very informative. Pricing get slashed too to be competitive with Amazon. What’s interesting is that these cloud VMs can be configured as an extension to your existing network. In the BI world, this would allow us to source data from existing on-premises data sources albeit probably over a much slower connection, such as to host your ETL, data mart and SSAS in the cloud or just the analytical layer. Speaking of connection speeds, the Azure bandwidth is actually good (5-15 GB/s) although it’s likely that is likely you’ll hit a bottleneck with your ISP on your way to and back from the cloud.
And, speaking of BI, check the SQL Server Business Intelligence in Windows Azure Virtual Machines document if you’re interested in cloud BI deployments. Notice that there are VM templates that install SSRS (native mode), SSAS (Multidimensional), as well as SharePoint 2013 but you can install manually the other components as well if you need to, such as Tabular. Microsoft recommends Extra Large VM size for BI deployments although its memory capacity (14 GB) might be on the lower end especially for Tabular.