Microsoft awarded me FastTrack Recognized Solution Architect – Power BI! This prestigious recognition is conferred by the Power Platform product engineering team for consistently exhibiting deep architecture expertise and creating high quality solutions for customers during project engagements. I’m one of the 33 individuals worldwide who must meet the following criteria:
Must have a minimum of 2 years of experience with Power BI and a minimum of 5 years of experience with Enterprise BI solutions
Must have a minimum of 2 years of experience as an Enterprise BI architect
Must be working for a partner with Gold certification in Data Analytics MPN competency
Must have been lead architect for at least 2 Power BI in-production implementations with at least 200 active users (Preferably for CAT managed customers)
I’m watching the witness testimonies for election irregularities in Georgia (the state where I live). I’m shocked about how this election became such a mess and international embarrassment. United States spent 10 billion on the 2020 election. Georgia alone spent more than 100 million on some machines the security experts said can be hacked in minutes. If we add the countless number of manhours, investigations, and litigations, these numbers will probably double by the time the dust settles down.
What did we get back? Based on what I’ve heard, 50% of Americans believe this election is rigged, just like 50% believed so in 2016. The 2020 election added of course more options for abuse because of the large number of mail-in ballots. It’s astonishing how manual and complicated the whole process is, not to mention that each state does things differently. But the more human involvement and moving parts, the higher the attack vector and probability for intentional or unintentional mishandling due to “human nature”, improper training, or total disregard of rules. I casted an absentee ballot without knowing how it was applied.
So, your humble correspondent thinks that it’s about time to computerize voting. Where humans fall short, machines take over. Unless hacked, algorithms don’t make “mistakes”. How about a modern Federal Internet Voting system that can standardize voting in all states? If the Government can put together a system for our obligations to pay taxes, it should be able to do it for the right to vote. If the most advanced country can get a vaccine done in six months, we should be able to figure out how to count votes. Just like in data analytics, elections will benefit from a single version of truth. Despite the security concerns surrounding a web app, I believe it will be far more secure that this charade that’s going on right now. In this world where no one trusts anyone, we can’t apparently trust bureaucrats to do things right.
Other advantages:
Anybody can vote from any device so no vote “suppression”
Better authentication (face recognition and capture, cross-check with other systems, ML, etc.)
Vote confirmation
Ability to centralize security surveillance and monitoring by an independent committee
Report results in minutes
Additional options for analytics on post-election results
My wife and I started section hiking the Appalachian Trail during weekends to escape the summer heat and the virus. A.T. runs for 2,200 miles from Georgia to Maine, with 78.6 miles in Georgia. Today we finished the Georgia part and entered North Carolina. We actually covered twice the distance (averaging 10-12 miles per section) because we had to come back each time to where we parked. We started hiking with the great Atlanta Outdoor Club back in February, 2020. But when the virus hit, group hikes were put on hold, so we were left to our own devices.
Hiking somehow grew on me. Perhaps, because it as a metaphor for life. There are ups and downs. Some sections are hard and require a great deal of effort and perspiration, while others are easy. There are exhilarating views but there are also areas with overgrown vegetation. Perceived risks, such as wild animals (note the bear spray on my belt ), are lurking in the distance. Some people tell you that you’re crazy. The climate is unpredictable, and planning is sometimes futile (we got ourselves in a really bad thunder storm and downpour once while the weather was supposed to be OK). But for the most part, it is just putting one foot in front of the other. It’s about the journey, not the destination. And the more you put in, the more you’ll get out.
Kudos to the wonderful people who maintain the A.T. and those who supported us with advice! Kudos to these brave thru-hikers that cover the whole distance. I’m really jealous…one day maybe.
I’m preparing to teach the brand new Analytics in a Day course by Microsoft. This course emphasizes the business value and technical fundamentals for implementing a modern cloud DW using Azure Synapse, ADF, Data Lake, and Power BI. The second half of the class is focused on Power BI and its role for creating organizational semantic models and self-service models from Synapse. I liked the best practices that Microsoft shares based on how they’ve adopted BI over years and challenges they faced with self-service BI, including:
Inconsistent data definitions, hierarchies, metrics, KPIs
Analysts spending 75% of their time collection and compiling data
78% of reports being creating in “offline environments”
Over 350 centralized finance tools and systems
Approximately $30M annual spend on “shadow applications”
Indeed, many vendors tout only self-service BI which can quickly lead to chaos. By contrast, I have found that most successful data-driven organizations have both organizational and self-service BI.
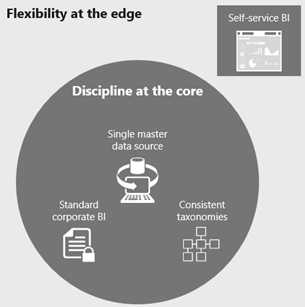
Microsoft calls the collection of these best practices “Discipline at the Core, Flexibility at the Edge“.
“Discipline at the Core” is organizational BI where IT retains control to:
Deliver standardized and performant corporate BI (single version of truth)
Define consistent taxonomies, hierarchies, and KPIs
Enforce data permissions centrally.
“Flexibility at the Edge” is self-service BI where data analysts:
Quickly create reports sourced from trusted data
Mashup core data with departmental data
Create new metrics and KPIs relevant to their part of the business
I further recommend the 80/20 rule as a rough guideline, where most of the effort (as much as 80%) goes into integration and curating the data, implementing enterprise models, and enforcing security, and 20% is left for the agility of self-service BI.
Is your organization disciplined at the core, or is the core missing as a result of blind adherence to the self-service BI mantra?
https://prologika.com/wp-content/uploads/2016/01/logo.png00Prologika - Teo Lachevhttps://prologika.com/wp-content/uploads/2016/01/logo.pngPrologika - Teo Lachev2020-08-06 12:02:122020-08-06 14:04:19Discipline at the Core, Flexibility at the Edge
I’ve providing advisory services to a Fortune 500 organization for a few months now. As all large organizations, they adopted Power BI Premium. However, they have provisioned only one Power BI Premium P1 node which has been showing signs for overutilization. In the process, I discovered they have purchased 40 Power BI Premium cores with 32 cores left unutilized! In other words, they used 1/5 of what they’ve been paying Microsoft as Power BI Premium fees. How did they arrive at this unfortunate situation?
A year or so ago, they used the Power BI Premium Calculator to estimate the licensing cost on their own. They plugged in 10,000 users and got a recommendation for 5 P1 nodes (or 40 cores). And that’s what they bought, assuming that they will get a cluster of five P1 nodes that would load balance the reports across nodes. When they set up Power BI Premium, they set up only one P1 capacity and all the important reports got in there. And these reports have been running just fine for a long time with thousands of users … The other 32 cores – sitting ducks.
Power BI Premium doesn’t currently load balance across nodes. Once you’ve licensed a certain number of cores, it does give you the flexibility to provision nodes of different sizes. So, with 40 licensed cores, you can set up 5 P1 nodes, or 2 P2 nodes and 1 P1 node, or one P3 node and 1 P1 node. Unfortunately, the flexibility ends there. Once you provision the capacity, the meter is running use it or not. And if you’re not using all these licensed cores, you still pay unless you manually scale down the capacity. I hope to see Power BI Premium Serverless sometimes in the future, where the service scales up and down on demand and you pay for what you really consume. This will void the decision on how much capacity and nodes you need, probably save you lots of money, and make Power BI Premium more affordable.
The moral of this story? Hire a trusted advisor and technology expert, and save a lot!
https://prologika.com/wp-content/uploads/2016/01/logo.png00Prologika - Teo Lachevhttps://prologika.com/wp-content/uploads/2016/01/logo.pngPrologika - Teo Lachev2020-07-24 17:45:102020-07-24 17:45:10Why You Need a Trusted Advisor
I’ve seen various reports designed to track COVID-19. I personally like the Microsoft Bing tracker (https://www.bing.com/covid). Not only does the report track the current counts, but it also shows a trend over time. It even goes down to a county level (the trend is not available at that level)! And it’s very fast. As good as it is, this is one report I hope I don’t have to use for long… Stay healthy!
A few months ago, I did an assessment for a large company that was advised by an undisclosed source that they should use their Dynamics Financials and Operations (F&O) system as a data warehouse. Recently, I came across a similar wish to use SAP as a data warehouse. I understand that people want to do more with less and shortcuts are tempting. But ERP systems can’t fulfill this purpose, and neither can other systems of record. True, these systems might have analytical features, but these features typically deliver only operational reporting. Operational reporting has a narrow view concerned with “now”, such as a report that shows customers with outstanding balances as of today. By contrast, BI is mostly concerned with historical and trend analysis.
In math, axioms are statements that are assumed to be correct without a proof. We need BI axioms and the list can start like this:
Every mid to large company shall have a centralized data repository for consolidating trusted data that is optimized for reporting. The necessary for such a repository is in a direct proportion with the number of the data sources that must be integrated (that number will increase over time) and the complexity of the data transformation. The centralized data repository is commonly referred to as a data warehouse.
Dimensional modeling shall be the methodology to design the data warehouse schema. I know it’s tempting to declare your ODS as a data warehouse, but highly normalized schemas are not suitable for reporting.
If you’re after a single version of the truth, you shall have an organizational semantic layer.
ERP systems are not a replacement for a data warehouse. Neither are data lakes and Big Data.
You shall have both organizational and self-service BI, and they should complement each other. If you lean too much toward organization BI, you’ll get a backlog of requirements. If you lean too much toward self-service BI, you’ll end up with fragmented “spreadmarts”, which is where you probably started.
Most of the BI effort should go toward organizational BI to integrate data, improve data quality, and centralize business calculations. Tools come and go but this effort shall endure.
Agile and managed self-service BI shall fill in the gaps. It should provide a feedback loop to extend organizational BI with data that the entire organization can benefit from.
My wife bought a pack of replacement water filters from Amazon. It was tagged as “Amazon’s choice”. The product listing showed the manufacturer name and it had a nice product photo advertising genuine filters. Except that there were all fake, which we discovered quickly by the output water pressure. The water coming out of a filter should have lower pressure while there was no difference with the “genuine” filter as though there was no filtering going on at all. And the water had a bad aftertaste. So, we call the manufacturer. They compared the batch number from the package (manufactured in China) and found it fake. That filter could have had some Chinese poison in it and Amazon would have sold it under “Amazon’s choice”. BTW, when we reported this to Amazon, the product was listed under a different seller.
There is a lot of noise (mostly vendor-induced propaganda as previously with Big Data) around AI, ML, and other catchy flavors of predictive analytics. I have a lot of respect for Amazon and I’m sure they know a lot about ML. Yet, fake products sneak in undetected and bad people find ways to cheat the system. In fact, I don’t think that advanced analytics is needed to solve this problem. All Amazon has to do is let big name manufactures register their approved resellers on the Amazon website. If the seller is not on the list, Amazon could flash a big juicy warning for the buyer. This would be a win-win for Amazon by improving their credibility as a retailer, manufacturers, and buyers. BTW, many manufacturers don’t sell on Amazon because of the exact same reason: counterfeited products that harm the brand.
But Amazon, whose platform’s main goal appears to be making as much money as possible by “democratizing” the retail industry, doesn’t do this. I might not know much about business, but I know that trust is paramount. When corporate greed takes over and their platform tags fake products as “Amazon’s choice”, where is that trust? BTW, I was told by the Amazon’s rep is that I could have a better confidence that a product is genuine if it says that it’s “sold and distributed by Amazon”. Which makes me skeptical because it means that their warehouses must be divided in two areas: one for sold and distributed by Amazon that stores genuine products supposedly procured by Amazon and another for sold by someone else but distributed by Amazon. Somehow, I doubt they do this.
So, Amazon, apply ML to predict the probability of buying a genuine product and show me the confidence score. Perhaps, I’ll buy more…
Business Performance Management (BPM) is a methodology to help the company predict its performance. An integral part of a BPM strategy is a process for Budgeting, Planning, and Forecasting which is typically performed by the Finance department. When it comes to Finance, nothing is simple, and BPM is no exception. This diagram illustrates what typical data movement might look like to consolidate BPM areas into a consolidated Financials view.
In this case, a client wanted to automate budgeting for the Sales, General, and Administrative accounts (SG&A). To clarify the jargon, SG&A accounts capture overhead cost, such as salaries and bonus, and this client used Workday to record these expenses for each employee.
I typically see companies take two paths when it comes to BPM:
Home-grown Excel-based solutions – You can do anything in Excel, but this path typically leads to fragile solutions that collapse under their weight.
High-end planning solutions – To get out of the Excel “spreadmarts”, the temptation is to buy a high-end commercial software, such as Hyperion. This path leads to a very high initial investment and then even higher “customization”.
A better option that we pursued was to implement a customized solution based on the Microsoft BI platform. This approach reduces cost and allows users to make changes using the tool they like most: Excel.
For example, the screenshot below shows how the user can filter the report at any level and make changes to the forecast values (in blue color).
The main benefits of this solution are:
Automated retrieval of actuals from the company’s data warehouse (also designed by Prologika)
A highly-customized solution that meets complex business needs
Management has immediate access to actuals, budget, and forecast
Elimination of manual entry and data errors.
Ability to analyze company’s performance by various dimensions.
How does your company do business performance management?
Want to know what Power BI features are in the works and when they will be released? My “Power BI Features Report” showed you how to find what features were released over time so it’s retrospective. On the other hand, Business Applications Release Notes are forward looking. For example, the October release notes for BI go all the way to March 2019. The release notes are for all business apps (not just Power BI): Dynamics, BI, PowerApps, Flow, AI, and others. There is also a change log.