Posts

Semantic Layer Flavors

Semantics relates to discovering the meaning of the message behind the words. In the context of data and BI, semantics represents the user’s perspective of data: how the end user views the data to derive knowledge from it. As a modeler, your job is to translate the machine-friendly database structures and terminology into a user-friendly semantic layer that describes the business problems to be solved and centralizes business calculations. Different vendors have different ideology and implementations of semantic layers. Some, such as Oracle and MicroStrategy, implement the semantic layer as a thin, pass-through layer whose main goal is to centralize access to data sources, metadata and business calculations in a single place.

A Fortune 100 company that had a major investment in Oracle engaged us to recommend a solution for complementing their OBIEE semantic layer with user-friendly reporting tool that would allow end users to create ad hoc transactional reports from their Oracle Exadata-based enterprise data warehouse. In the OBIEE world, the role of the semantic layer is fulfilled by the Common Enterprise Information Model that encompasses data sources, metrics, calculations, definitions, and hierarchies. When users submit report queries, the Oracle BI Server compiles incoming requests and auto-generates native queries against the data sources plugged in the Common Enterprise Information Model.

In theory, this “thin” implementation should work pretty well. In reality, several issues surface:

  1. Performance – Any tool, either a reporting tool or semantic layer, that auto-generates queries should be highly suspect of performance issues. First, no matter how well the tool is designed, it’s unlikely that it would generate efficient queries in all cases. Second, because the tool sends the query to the underlying data source, the overall report performance is determined by how fast the data source crunches data. In this case, the organization was facing performance issues with data aggregation. To circumvent them, their BI developers have implemented summarized fact tables. Once the user reaches the lowest level of the summary fact table, OBIEE would allow the user to drill down to a chained table, such as the actual fact table. Needless to say, business users were complaining that analysis was limited to the dimensionality of the summarized fact table. Further, to avoid severe performance issues with historical reports, the BI developers have taken the “no big aggregations, no problem” approach by forcing a time filter on each request that touches the large fact tables. This effectively precluded historical analysis by year, quarter, etc.
  2. Scalability – When a query involves multiple data source, OBIEE would send a query to each data source, load the data in memory, and then join the datasets together to find matching data. This also presents performance and scalability challenges. To solve performance and scalability issues with “thin” semantic layers and biggish data, organizations ultimately resort to expensive back-end MPP systems, such as Teradata or Netezza, which can parallelize data crunching and compensate for inefficient auto-generated queries.
  3. Common Denominator – You’re limited you to a subset of supported features of the underlying data source.
  4. Vendor Dependency – Such an architecture ultimately locks you in the data sources supported by the vendor. What happens when there is a new version of the data source that has some cool new features? Well, you need to wait until the vendor officially supports the new version and its extensions.

In the Microsoft BI world, the role of the semantic layer is fulfilled by the Business Intelligence Semantic Model (BISM). BISM is an umbrella name that encompasses two technologies: Multidimensional for implementing OLAP cubes and Tabular for designing relational-like models. The big difference is that by default both Multidimensional and Tabular store data on the server. In order words, from a data perspective, you can view BISM and its default storage mode (MOLAP for Multidimensional and xVelocity for Tabular) as a disk-based (MOLAP) or in-memory (xVelocity) cache of the data in your data warehouse. This proprietary storage is designed for fast data crunching even with billions of rows. You pay a price for loading and refreshing the data but you enjoy great query performance with historical and trend reports. And, you get a great ROI because you may not need an expensive MPP appliance or excessive data maintenance. When sent to BISM, queries are served by BISM, and not by the RDBMS. No need for summarized tables and time filters.

Solving Laptop Overheating Problems

Off the BI path but I wanted to save this tip for future generation and my sake in case I forget and I run into the same issue in Windows.NEXT or a new laptop. My $3,500 HP 3-year old EliteBook 8540w is prone to overheating. If a task puts a sustained pressure on the CPU, e.g. 10% or more, the fan engages and produces a noise like a howling wind in winter. It’s not so bad but it’s good enough to destroy my faith in HP… and embarrass me during meetings. The bottom of the laptop gets hot to a point where it can’t be used a laptop anymore. Eight months after I bought the laptop it became so bad that it would shut down from overheating so HP had to replace its motherboard and heat sink. And, now that the 3-year warranty expired it’s getting worse again.

Anyway, what got me curious is what causes CPU activity when the laptop is idle so I could minimize the level of its noise and embarrassment. I open the Windows 8 resource monitor (resmon.exe) and Task Manager side by side. I’ve noticed the problem gets worse when Office 2013 is running. This causes the Windows Search Index (SearchIndexer.exe) and SearchProtocolHost.exe to spring in the background, drawing more and more CPU time over time. I ran across a tip on the Internet that this happens if the Outlooks folders are above 2 GB in size. True, one of the Outlook archive folders and my main folder were above 2 GB so I had to do some pruning.

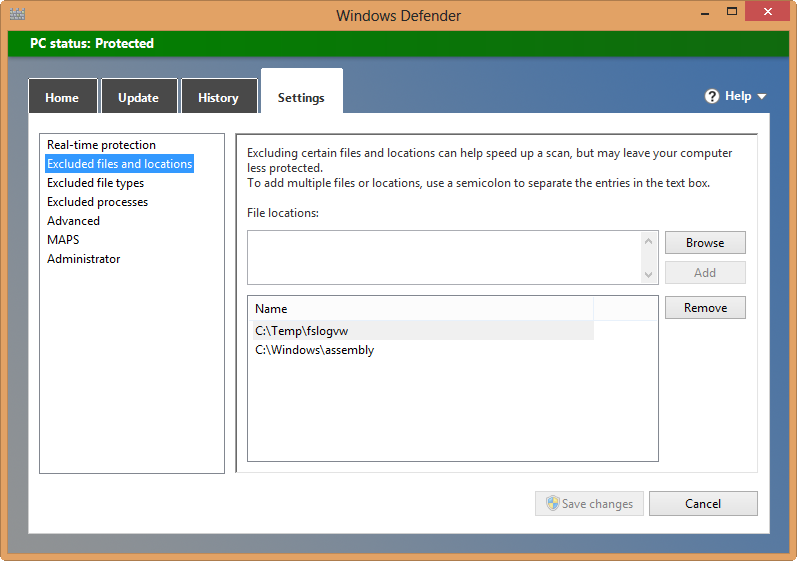
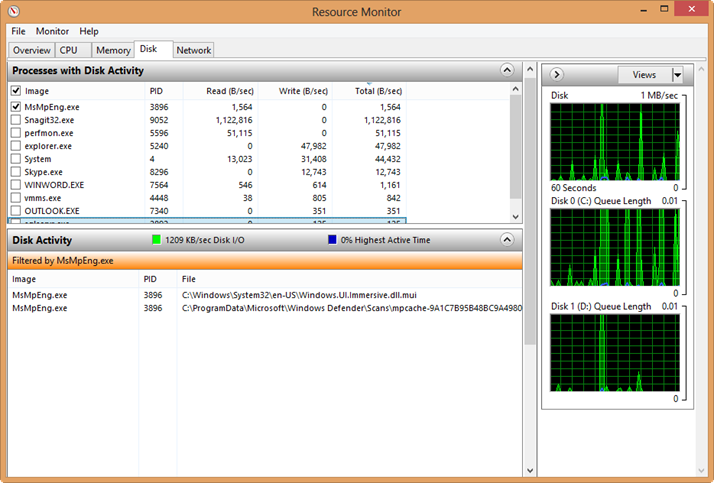
Another thing I’ve noticed is that the Antilmalware Service Executable (MsMpEng.exe), aka Windows Defender, will poke his head every now and then and draw some CPU cycles contributing to the CPU overhead. The Resource Monitor would show that the Antilmalware Service Executable would scan C:\Temp\fslogvw (the screenshot is meant to show how you can check what files a process accesses).

071513_0155_SolvingLapt1

When this happens, the Task Manager would show mscorsvw.exe surging in CPU utilization. Mscorsvw.exe is precompiling .NET assemblies in the background, e.g. after a Windows update, so this is normal. When this happens, it generates .NET native images in C:\Temp\fslogvw so I had to exclude this folder and c:\windows\assembly from the Microsoft Defender real-time protection.

071513_0155_SolvingLapt2

I left the Search Indexer to scan the new Outlook folders. When it was done it appeared that the CPU utilization is back to normal when the laptop was idle. One more tip. Disassemble the laptop and remove the fan cover as explained in the HP Maintenance and Service Guide. Then, clean the dust in the fan socket. In my case, there wasn’t much dust but you should probably start with cleaning if you run into overheating issues.

Microsoft Kerberos Configuration Manager for SQL Server

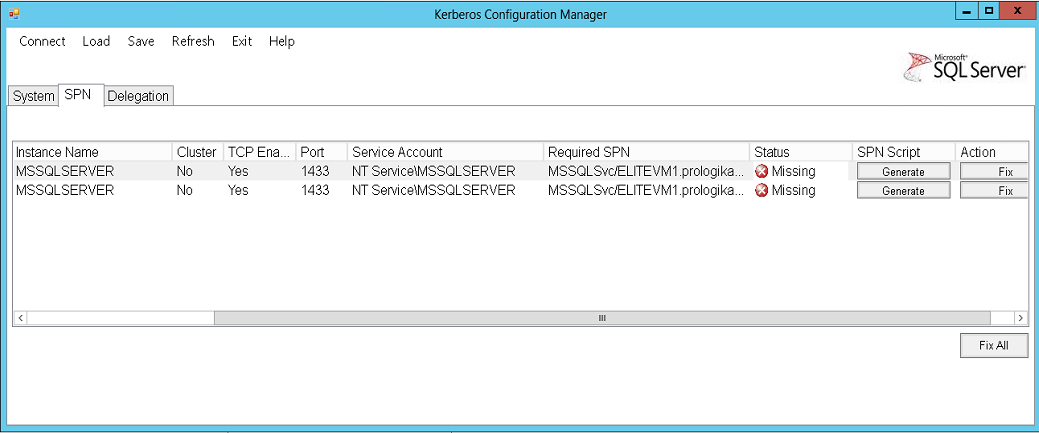
Anyone who has gone through configuring Kerberos knows that it’s not fun. After having done a few installations, my personal record for configuring Kerberos for SharePoint, SSAS, SSRS, SQL Server, and PerformancePoint was 4 hours but I had all parties including the AD administrator in the same room. In an attempt to facilitate troubleshooting Kerberos, Microsoft released Microsoft Kerberos Configuration Manager for SQL Server. It’s a simple diagnostic tool for troubleshoot Kerberos issues related to SQL Server.

Once you install and start the tool, you connect to the desired instance (requires SQL Server standard authentication to a remote server). Then, the tool checks the service account and discovers what SPN’s are registered for that account and what delegation options are configured in Active Directory. If it finds inconsistencies, it is capable of generating a script that your AD administrator can run or applying the fix interactively.

052413_1320_MicrosoftKe1

As a side note, be aware that if Kerberos doesn’t work, SSRS, Power View, and PerformancePoint 2013 supports SSAS authentication using EffectiveUserName.

When Developers and BI Collide

I’ve been running in this situation quite often so I thought this will make a good topic for a blog.

Scenario: Management has asked for some sort of a BI solution, such as a dashboard. BI hasn’t happened to the organization in question yet. But they have smart developers and there is no project that they can’t do. As the story goes, developers go to work and whip out some code… lots of it. Code for doing ETL, code for the database layer, and code for implementing the presentation layer, such as as a custom web application with cool third-party widgets. Everyone is happy… at least for a while.

I don’t have an issue with developers. In fact, I spent most of my career writing code. However, there are several pitfalls with this approach so let’s mention some of them:

  1. Custom code is expensive to write and maintain – Developers are pulled away from their primary tasks to implement the BI solution. When the initial enthusiasm wears off, managers find it difficult to allocate developers to extending and maintaining the BI solution.
  2. You end up with a proprietary, tightly-coupled solution – The solution would probably meet the initial goals but it might be difficult to extend. What if the custom web application is not enough and users prefer to analyze data in another tool, such as Microsoft Excel? Where are business calculations defined? How do you handle security?
  3. Not the right tools – There are many scenarios when writing custom code makes sense but BI is not one of it. There are specialized tools that are geared specifically toward BI. If you write custom code, more than likely you’ll face performance and maintenance challenges in a long run.
  4. Not a best practice – Most projects start simply but grow in complexity over time. It’s not uncommon for management to ask for more features, such as analyzing data by other subject areas or drilling to details. What’s has started as a dashboard project might evolve to an end-to-end BI solution that requires a data warehouse, analytical layer, and different presentation options.
  5. Coders are not BI pros – I hate to say this but even the smartest programmers don’t know much or care about BI. More than likely, you’ll end with a normalized database and summary tables for improving performance with aggregates. Again, there tools and methodologies for BI so there is no point reinventing the wheel. If you don’t know better, hire someone who does. “When all you have is a hammer everything looks like a nail” paradigm won’t bring you too far.

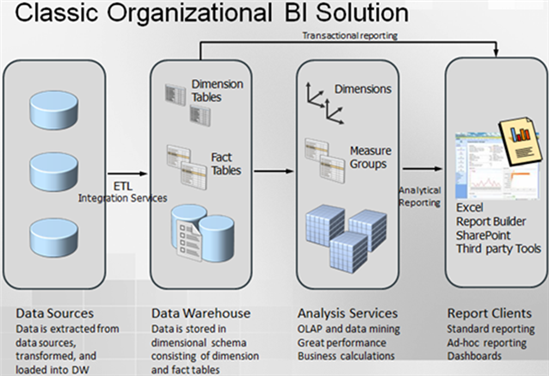
Solution: I’m sure you can add to the list, but what’s the solution? When you hear about BI or its manifestations, such as dashboards, reporting, analytics, etc., the following architecture should immediately come to mind.

3806.biarch.png-550x0

This architecture is somewhat simplified. For example, it doesn’t show a staging database but it has the main pieces and their corresponding technologies in the Microsoft BI platform:

  1. A data warehouse whose schema is designed with reporting in mind.
  2. Integration services packages for ETL processes. They still have to be maintained but I dare to declare that maintaining SSIS is much easier that maintaining custom code. For example, it doesn’t require coding skills, it scales well, and it has a comprehensive logging infrastructure.
  3. An analytical layer, either as a multi-dimensional cube or a tabular model. This is the most overlooked piece but it’s the most important for the reasons I explained in my “Why an Analytical Layer?” blog.
  4. Finally, just like a car manufacturer, you should strive to assemble your solution with prefabricated parts instead of writing custom code. For example, you can implement very compelling dashboards with Power View that uses your analytical layer as a data source without having to write a single line of code. Not to mention that you can delegate this task to business users.

Now, with custom code you can do anything, including features that you can’t get out of the box with prepackaged BI tools. However, you’ll be surprised how willing your management might be to compromise with features especially in this economy.

Happy Holidays!

As another year is winding down, it’s time to review and plan ahead. 2012 was a great year for both Prologika and BI. On the business side of things, we achieved Microsoft Gold BI and Silver Data Platform competencies. We added new customers and consultants. We completed several important projects with Microsoft acknowledging two of them.

2012 was an eventful year for Microsoft BI. SQL Server 2012 was released in March. It added important BI enhancements, including Power View, PowerPivot v2, Reporting Services End-User Alerting, Analysis Services in Tabular mode, Data Quality Services, Integration Services enhancements, MDS Add-In for Excel, Reporting in the Cloud, and self-service BI for Big Data with the Excel Hive add-in. The next BI wave came with Office 2013 and added important organizational and self-service BI features, including PowerPivot Integration in Excel 2013, Power View Integration in Excel 2013, Excel updatable web reports in SharePoint, productivity enhancements (Flash Fill, Quick Explore, Quick Analysis, and so on), PerformancePoint theming support and enhanced filtering, better mobile BI support, and self-service BI in Office 365.

Microsoft added support for Big Data and Hadoop both on cloud with HDInsight Service and on-premises with the CTP release of HDInsight Server. Finally, we got the public prerelease bits of DAXMD to connect Power View to multidimensional cubes.

As we witnessed, BI is a very important part of the Microsoft data strategy. Although overwhelming in times, I hope the trend will continue in 2013 and beyond. In the spirit of the season, here is my top 5 wish list:

  1. Continuing focus on integration and simplification – Fast-paced in nature, Microsoft BI has grown in complexity and redundancy through evolution and product acquisitions. Personally, I’d like to see further unification of the Multidimensional and Tabular models, so BI pros don’t have to choose which path to take and what compromise to make. Integration opportunities exist in other areas, such DQS and MDS, as well Tabular native support in the client tools (Excel and SSRS).
  2. Extending mobile BI reach – Customers are asking for it.
  3. Easier and simpler self-service BI – Excel 2013 has started the path but I think we can do a better job to simplify the user experience and compete more successfully with other self-service BI vendors.
  4. BI in the cloud – This will enable interesting scenarios and extend the reach of BI products and services.
  5. Enterprise lineage and change impact analysis – I think it’s about time to have this.

Most importantly, I hope to see Microsoft B having a renewed focus on customers in 2013. We should be listening more to our customers as sometimes as geeks we tend to be too much caught up in technology and we learn our lesson the hard way.

Stay happy and healthy in 2013!

122612_0146_HappyHolida1


SQL PASS 2012 Day 1 Announcements

I hope you watched the SQL PASS 2012 Day 1 Keynote live. There were important announcements and I was sure happy to see BI being heavily represented. For me, the most important ones were:

  1. The availability of SQL Server 2012 Service Pack 1

For some reason, this announcement went without being applauded from the audience although in my opinion it was the most important news from the tangible deliverables. First, I know that many companies follow the conventional wisdom and wait for the first service pack before deploying a new product. Now the wait is over and I expect mass adoption of SQL Server 2012. At Prologika, we’ve been using SQL Server 2012 successfully since it was in beta and I wholeheartedly recommend it. Second, SP1 is a prerequisite for configuring BI in SharePoint 2013, as I explained previously. Indeed, I downloaded and run the setup and I was able to continue the SharePoint 2013 PowerPivot configuration. BTW, the build number of SP1 is 11.0.2100.60.

Note If you’re configuring PowerPivot for SharePoint 2013, you must also install a PowerPivot for SharePoint 2013 add-in (there is a new installer package called spPowerpivot.msi) in order to get the upgraded version of the PowerPivot Configuration Tool for SharePoint 2013. If you open the RTM version of the PowerPivot Configuration Tool for SharePoint, it will promptly complain that it doesn’t know a thing about SharePoint 2013 and redirect you to this page. Unfortunately, at this time, the link on this page points to the Community Technology Preview of the SQL Server 2012 SP1 Feature Pack and the whereabouts of the official SP1 release of the feature pack are not known (the Feature Pack was published with an incomplete list of files). I downloaded and ran the CTP version of and then ran the PowerPivot Configuration Tool for SharePoint 2013. It appears that the CTP version did a respectable job and all it was capable of successfully configuring PowerPivot for SharePoint. However, please wait for the official release of the SQL Server 2012 Feature Pack to avoid issues.

  1. Power View for Multidimensional – OK, the cat is out of the bag on this one and Amir showed a demo. As a participant of the CTP program Power View for Multidimensional, I’m very happy about it. That’s all I can say at this point while waiting for the public technology preview. Unfortunately, Power View for Multidimensional didn’t make it to SP1 and it’s not known at this point when and how it will ship. But if you have multidimensional cubes (and who doesn’t) the wait will be worthwhile I promise.
  2. Updatable Columnstore Indexes in SQL SERVER.NEXT – This a good news for users of columnstore indexes that will avoid dropping and recreating the indexes. This will be especially useful for columnstore indexes built on top of large fact tables, such as in the scenario I described here.
  3. Hekaton – Plans to ship a long-due in-memory OLTP technology in SQL Server.NEXT.
  4. Polybase – Another new technology slated for the next release of SQL Server 2012 Parallel Data Warehouse (expected in first half of 2013) that will allow you to run T-SQL queries joining relational data residing in PDW and Hadoop data. I guess this is the materialization of the David DeWitt’s Enterprise Data Manager idea that he talked about in his 2011 PASS presentation. I’m looking forward to his sequel which I suppose will go in details on this topic. Did we run out of cool names from the animal kingdom to succeed Hadoop, Mahoot, Pig, etc? I guess will find out in David’s talk.

Here is the list of the forthcoming live sessions.


UPDATE 11/8/2012

Here is a direct link to the release build of the PowerPivot Configuration Tool for SQL Server 2012 SP1.

Business Intelligence on Surface

Microsoft has started shipping the cool Surface RT tablets this week with Surface Pro to follow in January. Naturally, a BI person would attempt BI in Excel only to find that BI and Power View (no Silverlight support) are not there as Kasper explains. It’s important to know that the RT version of Surface is limited to native Windows 8 applications only, it comes preinstalled with Office 2013, and you can’t install non-Windows 8 applications. If you are interested in BI or running non-Windows 8 apps, you need the Pro version. This means that you and I need to wait until January next year so no Surface for Christmas.

Your Data Warehouse in the Cloud?

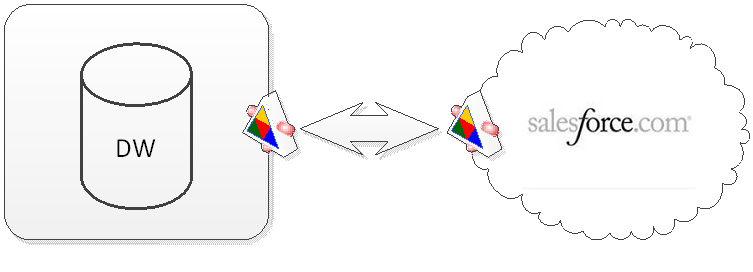
I spoke with a customer today that has implemented Salesforce.com. For those who are not familiar with Salesforce, it’s a popular cloud-based, customer relationship management (CRM) product. As it usually happens, just when you’re done with the Salesforce implementation, you’re immediately faced with the challenge of consolidated reporting. It won’t be long before the Vice President of Sales asks you to integrate sales data residing in Salesforce.com and your on-premise data sources. In this case, the customer went to Dreamforce (the Salesforce premier conference) in search for integration options and was advised to solve the report consolidation issue by … migrating their multi-terabyte data warehouse to Salesforce.com!

I’m sure that this approach makes perfect sense to Salesforce.com, but it’s hardly in the customer’s best interest. First, although Salesforce is extensible and you can add custom objects (tables), Salesforce.com is not designed to host relational databases. As far as I know, it doesn’t have ETL tools, an analytical layer, and comprehensive reporting capabilities. Second, even with the enormous recent strides in cloud computing and ever decreasing storage prices, it’s hard to imagine anyone moving a data warehouse to the cloud. It’s just cost-prohibitive to do so. Third, there are data logistics challenges to populate a cloud-based data warehouse, such as to upload gigabytes of data from on-premises databases to the cloud over Internet.

At Prologika, we advise our customers to keep data where it belongs: operational data in the on-premise data warehouse and sales data in the Salesforce.com cloud. By design, the data warehouse is an enterprise repository for storing and consolidating data from operational data sources. We design Integration Services packages to retrieve data by integrating with the Salesforce.com web service and importing the data into the data warehouse. This opens all kinds of interesting data analytical possibilities, such as implementing forecasting reports that combine actual and opportunity revenue.

When the customer requires reports that source data from the data warehouse, we implement a web service end point residing on the customer’s premises that allows Salesforce.com to pull data from the data warehouse and cubes. Or, if it’s acceptable for the sales people to be logged to the customer’s network, we extend Salesforce to pass parameters to operational reports hosted on premise, such in SharePoint. This bi-directional integration allows our customers to keep data where it belongs but allows each system to obtain data from the other system.

Sometimes, it’s better to keep your head and data out of the cloud no matter how modern and exciting this might sound.

101112_0155_YourDataWar1

Microsoft Case Study for Recall and Prologika

Microsoft published a case study “Records Management Firm Saves $1 Million, Gains Faster Data Access with Microsoft BI”. Prologika architected the data warehouse, OLAP cubes, and presentation layer consisting of operational reports, SharePoint management dashboard and Power View reports.

Recall, a records-management firm, needed faster access to key performance indicators and more intuitive business intelligence (BI) tools. The company consolidated four data centers into a Microsoft SQL Server 2012 data warehouse. The solution’s performance enhancements speed employee access to more detailed data. By consolidating into a data warehouse, the company saved U.S. $1 million in hardware and licensing costs…With help from Microsoft partners Prologika and Berg Information Technology, Recall started deployment in August 2011 and went into production in February 2012.

BIDS Helper 1.6 Beta Released

Fellow MVPs have just released the latest public beta build of BIDS Helper, which should one of the first utilities you install after you install SQL Server on your machine. Besides fixes and updates, this release adds support for SQL Server 2012 and new features specific to Analysis Services Tabular.

This beta release is the first to support SQL Server 2012 (in addition to SQL Server 2005, 2008, and 2008 R2). Since it is marked as a beta release, we are looking for bug reports in the next few months as you use BIDS Helper on real projects. In addition to getting all existing BIDS Helperfunctionality working appropriately in SQL Server 2012 (SSDT), the following features are new.

  • Analysis Services Tabular
  • Smart Diff
  • Tabular Actions Editor
  • Tabular HideMemberIf
  • Tabular Pre-Build