Atlanta BI fans, please join us in person for the next meeting on Monday, September 3th at 6:30 PM ET. Your humble correspondent will show you how to use Large Language Models, such as ChatGPT, to create your own copilots for Text2SQL and Text2DAX. I’ll also help you catch up on Microsoft BI latest. I will sponsor the event which marks the 14th anniversary of the Atlanta Microsoft BI Group! For more details and sign up, visit our group page.
Details
Presentation: Create Code Copilots with Large Language Models Delivery: In-person Date: September 3rd, 2024 Time: 18:30 – 20:30 ET Level: Beginner to Intermediate Food: Pizza and drinks will be provided
Agenda:
18:15-18:30 Registration and networking
18:30-19:00 Organizer and sponsor time (events, Power BI latest, sponsor marketing)
19:00-20:15 Main presentation
20:15-20:30 Q&A
Venue
Improving Office
11675 Rainwater Dr
Suite #100
Alpharetta, GA 30009
Overview: Resistance is futile! Instead of fearing that AI will take over our jobs, embrace it and apply it to outsource mundane work and create a new class of applications that were not possible before. In this session, I’ll introduce you through the fascinating world of Large Language Models (LLMs) and one of their practical applications in creating Text2SQL and Text2DAX copilots. I’ll demonstrate how LLMs open new opportunities for intelligent exploration. As an optional challenge, bring your laptop, download the code from my website (use the download link below), and follow along using your favorite AI chat, such as ChatGPT, which is what I’ll use for the demos, Microsoft Copilot, Meta AI, Google Gemini, or Perplexity.ai. You’ll also discover how you can automate LLM-powered copilots using Python and Azure OpenAI.
Speaker: Teo Lachev is a BI consultant, author, and mentor. Through his Atlanta-based company Prologika (https://prologika.com) he designs and implements innovative solutions that bring tremendous value to his clients and help them make sense of data. Teo has authored and co-authored many books, and he has been leading the Atlanta Microsoft Business Intelligence group since he founded it in 2010. Microsoft has recognized Teo’s contributions to the community by awarding him the prestigious Microsoft Most Valuable Professional (MVP) Data Platform status for 15 years. Microsoft selected Teo as one of only 30 FastTrack Solution Architects for Power Platform worldwide.
Sponsor: Prologika (https://prologika.com)
https://prologika.com/wp-content/uploads/2016/01/logo.png00Prologika - Teo Lachevhttps://prologika.com/wp-content/uploads/2016/01/logo.pngPrologika - Teo Lachev2024-08-12 11:46:242024-09-01 13:26:48Atlanta Microsoft BI Group Meeting on September 3rd (Create Code Copilots with Large Language Models)
Atlanta BI fans, please join us in person for the next meeting on Monday, August 5th at 6:30 PM ET. Elayne Jones and Matt Kim (Solutions Architects at Coca-Cola) will show us how to bring Azure DevOps data to life by creating data models and interactive reports in Power BI. Your humble correspondent will help you catch up on Microsoft BI latest. CloudStaff.ai will sponsor the event. For more details and sign up, visit our group page.
Details
Presentation: Elevate Program Management with Power BI & DevOps Delivery: In-person Date: August 5, 2024 Time: 18:30 – 20:30 ET Level: Intermediate Food: Pizza and drinks will be provided
Agenda:
18:15-18:30 Registration and networking
18:30-19:00 Organizer and sponsor time (events, Power BI latest, sponsor marketing)
19:00-20:15 Main presentation
20:15-20:30 Q&A
Venue
Improving Office
11675 Rainwater Dr
Suite #100
Alpharetta, GA 30009
Overview: Have you ever opened Azure DevOps and felt overwhelmed by the vast sea of program management options? In large organizations, tracking progress across disparate projects and work items can be challenging. In this session, find out how to bring Azure DevOps data to life by creating data models and interactive reports in Power BI. Sleek Power BI visuals make even the most technical DevOps content both accessible to executives and actionable for project managers.
Speaker: Elayne Jones and Matt Kim are both Solutions Architects at Coca-Cola Bottlers Sales and Services. Elayne and Matt specialize in developing solutions that drive efficiency within organizations by utilizing the full set of Power Platform technologies. Elayne and Matt work together on a team focusing on designing and implementing automated solutions to enhance both internal and external stakeholders’ user experiences and to enforce consistency in reporting data.
Sponsor: Cloudstaff.ai
https://prologika.com/wp-content/uploads/2016/01/logo.png00Prologika - Teo Lachevhttps://prologika.com/wp-content/uploads/2016/01/logo.pngPrologika - Teo Lachev2024-07-30 20:37:282024-07-30 20:37:28Atlanta Microsoft BI Group Meeting on August 5th (Elevate Program Management with Power BI & DevOps)
Atlanta BI fans, please join us in person for the next meeting on Monday, July 1st at 6:30 PM ET. John Kerski (Microsoft MVP) will shows us how to integrate ChatGPT with Power BI. Your humble correspondent will help you catch up on Microsoft BI latest. CloudStaff.ai will sponsor the event. For more details and sign up, visit our group page.
Details
Presentation: Commenting Power Query with Azure OpenAI Delivery: In-person Date: July 1, 2024 Time: 18:30 – 20:30 ET Level: Intermediate Food: Pizza and drinks will be provided
Agenda:
18:15-18:30 Registration and networking
18:30-19:00 Organizer and sponsor time (events, Power BI latest, sponsor marketing)
19:00-20:15 Main presentation
20:15-20:30 Q&A
Venue
Improving Office
11675 Rainwater Dr
Suite #100
Alpharetta, GA 30009
Overview: Large Language Models (such as ChatGPT) can greatly enhance the way you develop and deliver Power BI solutions. In this session I will show you how to integrate Azure Open AI into Power BI using prompt engineering techniques.
Speaker: John Kerski has over a decade of experience in technical and government leadership. He specializes in managing Data Analytics projects and implementing DataOps principles to enhance solution delivery and minimize errors. John’s expertise is showcased through his ability to offer patterns and templates that streamline the adoption of DataOps with Microsoft Fabric and Power BI. His in-depth knowledge and hands-on approach provide clients with practical tools to achieve efficient and effective data operations.
Sponsor: CloudStaff.ai
https://prologika.com/wp-content/uploads/2016/01/logo.png00Prologika - Teo Lachevhttps://prologika.com/wp-content/uploads/2016/01/logo.pngPrologika - Teo Lachev2024-06-25 11:14:362024-06-25 11:14:36Atlanta Microsoft BI Group Meeting on July 1st (Commenting Power Query with Azure OpenAI)
Atlanta BI fans, please join us for the next meeting on Monday, August 7th, at 6:30 PM ET. James Serra (Data & AI Solution Architect at Microsoft) will join us remotely to introduce us to Microsoft Fabric. For more details and sign up, visit our group page.
PLEASE NOTE A CHANGE TO OUR MEETING POLICY. WE HAVE DISCONTINUED ONLINE MEETINGS VIA TEAMS. THIS GROUP MEETS ONLY IN PERSON. WE WON’T RECORD MEETINGS ANYMORE. THEREFORE, AS DURING THE PRE-PANDEMIC TIMES, PLEASE RSVP AND ATTEND IN PERSON IF YOU ARE INTERESTED IN THIS MEETING.
Presentation: Introducing Microsoft Fabric
Delivery: Speaker will join us remotely via Teams
Date: August 7th
Time: 18:30 – 20:30 ET
Level: Beginner
Food: Sponsor wanted
Agenda:
18:15-18:30 Registration and networking
18:30-19:00 Organizer and sponsor time (events, Power BI latest, sponsor marketing)
19:00-20:15 Main presentation
20:15-20:30 Q&A
ONSITE
Improving Office
11675 Rainwater Dr
Suite #100
Alpharetta, GA 30009
Overview: Microsoft Fabric is the next version of Azure Data Factory, Azure Data Explorer, Azure Synapse Analytics, and Power BI. It brings all these capabilities together into a single unified analytics platform that goes from the data lake to the business user in a SaaS-like environment. Therefore, the vision of Fabric is to be a one-stop shop for all the analytical needs for every enterprise and one platform for everyone from a citizen developer to a data engineer. Fabric will cover the complete spectrum of services including data movement, data lake, data engineering, data integration and data science, observational analytics, and business intelligence. With Fabric, there is no need to stitch together different services from multiple vendors. Instead, the customer enjoys end-to-end, highly integrated, single offering that is easy to understand, onboard, create and operate.
This is a hugely important new product from Microsoft, and I will simplify your understanding of it via a presentation and demo.
Speaker: James Serra works at Microsoft as a big data and data warehousing solution architect where he has been for most of the last nine years. He is a thought leader in the use and application of Big Data and advanced analytics, including data architectures, such as the modern data warehouse, data lakehouse, data fabric, and data mesh. Previously he was an independent consultant working as a Data Warehouse/Business Intelligence architect and developer. He is a prior SQL Server MVP with over 35 years of IT experience. He is a popular blogger (JamesSerra.com) and speaker, having presented at dozens of major events including SQLBits, PASS Summit, Data Summit and the Enterprise Data World conference. He is the author of the upcoming book “Deciphering Data Architectures: Choosing Between a Modern Data Warehouse, Data Fabric, Data Lakehouse, and Data Mesh”.
https://prologika.com/wp-content/uploads/2016/01/logo.png00Prologika - Teo Lachevhttps://prologika.com/wp-content/uploads/2016/01/logo.pngPrologika - Teo Lachev2023-08-01 11:13:522023-08-01 11:13:52Atlanta Microsoft BI Group Meeting on August 7th (Introducing Microsoft Fabric)
Atlanta BI fans, please join us for the next meeting on Tuesday, July 11th, at 6:30 PM ET. Stacey Jones (Cross Solution Architect at Microsoft) will join us in person to present OpenAI and Copilot. Your humble correspondent will demo the newly released PBI Desktop project format. For more details and sign up, visit our group page.
PLEASE NOTE A CHANGE TO OUR MEETING POLICY. EFFECTIVE IMMEDIATELY, WE ARE DISCONTINUING ONLINE MEETINGS VIA TEAMS. THIS GROUP MEETS ONLY IN PERSON. WE WON’T RECORD MEETINGS ANYMORE. THEREFORE, AS DURING THE PRE-PANDEMIC TIMES, PLEASE RSVP AND ATTEND IN PERSON IF YOU ARE INTERESTED IN THIS MEETING.
Presentation: Azure OpenAI – Answers to Your Natural Language Questions
Date: July 11th (Please note that because of the July 4th holiday, this meeting is on Tuesday)
Time: 18:30 – 20:30 ET
Level: Intermediate
Food: As of now, food won’t be available for this meeting. We are welcoming suggestions for a sponsor.
Agenda:
18:15-18:30 Registration and networking
18:30-19:00 Organizer and sponsor time (events, Power BI latest, sponsor marketing)
19:00-20:15 Main presentation
20:15-20:30 Q&A
ONSITE
Improving Office
11675 Rainwater Dr
Suite #100
Alpharetta, GA 30009
Overview: We will overview and explore Azure OpenAI, a fusion of OpenAI with the Azure cloud. Understand what OpenAI and CoPilot are as well as how they can help you with your natural language questions. We will also address questions about AI, such as will AI take over the world?
Speaker: Stacey Jones is a Cross Solution Architect specializing in all things Data, AI and Power BI. He is Evangelist at Microsoft’s Technology Center (MTC) in Atlanta, GA. He has 30+ years of industry experience in technology management spanning data architecture, data modeling, database development, tuning, and administration in both Oracle and SQL Server. He is active on LinkedIn and has plenty of real-life experience putting out database performance fires.
https://prologika.com/wp-content/uploads/2016/01/logo.png00Prologika - Teo Lachevhttps://prologika.com/wp-content/uploads/2016/01/logo.pngPrologika - Teo Lachev2023-07-05 07:41:242023-07-05 07:41:24Atlanta Microsoft BI Group Meeting on July 11th (Azure OpenAI – Answers to Your Natural Language Questions)
The Atlanta MS BI and Power BI Group is resuming in-person meetings! Please join us for the next meeting on Monday, December 5th, at 6:30 PM ET. Your humble correspondent will show you how to implement a custom solution for automating planning, budgeting, and forecasting based on a real-life project. For more details and sign up, visit our group page.
WE ARE RESUMING IN-PERSON MEETINGS STARTING DECEMBER 5, 2022, AT THE MICROSOFT OFFICE IN ALPHARETTA. WE STRONGLY ENCOURAGE YOU TO ATTEND THE EVENT IN PERSON FOR BEST EXPERIENCE. PLEASE NOTE THAT GUESTS ENTERING MICROSOFT BUILDINGS IN THE U.S. MUST PROVIDE PROOF OF VACCINATION OR SELF-ATTEST WITH HEALTHCHECK (HTTPS://AKA.MS/HEALTHCHECK). ALTERNATIVELY, YOU CAN JOIN OUR MEETINGS ONLINE VIA MS TEAMS. WHEN POSSIBLE, WE WILL RECORD THE MEETINGS AND MAKE RECORDINGS AVAILABLE AT HTTPS://BIT.LY/ATLANTABIRECS. PLEASE RSVP ONLY IF COMING TO OUR IN-PERSON MEETING.
Presentation: Automate and Improve Budgeting, Planning, and Forecasting
Overview: Business Performance Management (BPM) is a methodology to help the company predict its performance. An integral part of a BPM strategy is a process for Budgeting, Planning, and Forecasting which is typically performed by the Finance department. When it comes to Finance, nothing is simple, and budgeting is no exception. The temptation is to buy expensive prepackaged software but even that route would require a lot of customization and compromises.
Join this session to learn how to implement your own home-grown solution using Microsoft Analysis Services and Excel. I’ll share lessons learned from a real-life project.
Speaker: Teo Lachev is a consultant, author, and mentor, with a focus on Microsoft BI. Through his Atlanta-based company Prologika he designs and implements innovative solutions that bring tremendous value to his clients. Teo has authored and co-authored several books, and he has been leading the Atlanta Microsoft Business Intelligence group since he founded it in 2010. Microsoft has recognized Teo’s contributions to the community by awarding him the prestigious Microsoft Most Valuable Professional (MVP) Data Platform status for 15 years. Microsoft has selected Teo as one of only 30 FastTrack Solution Architects for Power BI worldwide.
Sponsor: Prologika (a Microsoft Gold Partner in Data Analytics and Data Platform and Power BI Red Carpet Partner) helps organizations of all sizes to make sense of data. Your BI project will be your best investment, we guarantee it! prologika.com
https://prologika.com/wp-content/uploads/2016/01/logo.png00Prologika - Teo Lachevhttps://prologika.com/wp-content/uploads/2016/01/logo.pngPrologika - Teo Lachev2022-11-29 11:59:572022-12-02 15:29:16Atlanta MS BI and Power BI Group Meeting on December 5th (Automate and Improve Planning, Budgeting and Forecasting)
Please join us online for the next Atlanta MS BI and Power BI Group meeting on Monday, November 7th, at 6:30 PM ET. Sandeep Pawar will join us again to show us the Power BI data science features and how you can create ML models. For more details and sign up, visit our group page.
The use of Data Science tools and techniques has grown in the last few years and BI developers are collaborating closely with the Data Scientists. In this session, we will learn about some of the core concepts in data science, key terminologies and the overall process so that you as a BI developer can effectively collaborate with your Data Science team. You will learn about analogous features in Power BI, their pitfalls, the overall Machine Learning process and the questions you should be asking the next time you are consuming the ML model in Power BI.
This session won’t teach you how to create Machine Learning models, rather it will show you how you should consume the Machine Learning models as a BI developer to help your business users.
Speaker:
Sandeep Pawar is a Sr. Power BI Architect at Hitachi Solutions America. He has extensive experience in creating data analytics and data science solutions. You can read more about him and his passion for data at www.pawarbi.com or follow him on twitter at @PawarBI.
Prototypes without Pizza
Power BI Latest
https://prologika.com/wp-content/uploads/2016/01/logo.png00Prologika - Teo Lachevhttps://prologika.com/wp-content/uploads/2016/01/logo.pngPrologika - Teo Lachev2022-11-02 08:30:472022-11-02 08:32:31Atlanta MS BI and Power BI Group Meeting on November 7th (Data Science for Power BI Developers)
A recent ask from an airline company was to perform sentiment analysis on comments in surveys collected from their customers. Sentiment analysis is a machine learning task that requires natural language processing.
In Power BI, we have at least two ways to approach this requirement: Cognitive Services and custom code, such as by using the Python Natural Language Toolkit (NLTK).
This post compares the pros and cons of each option based on my impressions so far.
Cognitive Services
Python
Licensing
Included in premium or embedded capacity
or, provisioned separately with Azure subscription with Power BI Pro
Freely available
Provisioning
Already provisioned with premium or embedded (need to enable AI workloads)
Install Python
Install pandas, matplotlib, and nltk packages
Language detection
Yes
No
Data refresh
No gateway required
Personal gateway required
Enhanced dataset metadata
Supported
Not supported
Cognitive Services
Cognitive Services is an Azure PaaS cloud service that supports text analytics and image recognition. It’s automatically included in Power BI Premium or Embedded capacities (make sure that AI workloads are enabled in the capacity settings). If you organization doesn’t have Power BI Premium or Embedded, you can provision Cognitive Services in Azure (requires an Azure subscription) and then write a custom Power Query function to invoke its APIs, as demonstrated by this tutorial. If you provision Cognitive Services outside Power BI Premium, you’ll be charged per transaction. In the case of Power BI, the number of transactions equates to the number of rows in your table. So, if you refresh five times a table with 1,000 rows and calculate the sentiment polarity score for each row, you’ll be charged for 5,000 transactions.
You can integrate Power BI with Cognitive Services in a Power BI dataflow or within Power Query in Power BI Desktop. The latter option requires specifying a premium or embedded capacity if you want to go code-free and use the Text Analytics feature (Home ribbon in Power Query). Otherwise, you must write M code as the above tutorial shows.
One CS feature that proved very useful is the automatic language detection. In my case, I had comments in different languages. When each row is processed, Power BI will send a “transaction” to Cognitive Services. If you leave the second parameter (language) of the API call to null, Cognitive Services will try to detect it on its own!
Refreshing data and rescoring do not require a Power BI gateway because Cognitive Services is a cloud service.
Python
When budget is tight or you can’t get help from IT to provision Cognitive Services, Python might come to the rescue. The main advantage of this option is that is free. But, you need at least a few lines of Python code (or much more if English is not the only language you need to support), as this article demonstrates. You must install Python (TIP: install it from python.org as Anaconda doesn’t work with Python scripts since there isn’t way to start the Anaconda environment before the script runs), configure Power BI for Python scripting, and install pandas, matplotlib, and nltk packages . A great feature of Power Query is that you can add a Python transformation that can call the Python script inside your Power Query transformation steps.
As far as I could tell, handling multiple languages is not an easy task with Python NLTK. You can easily detect the language, but there are no built-in dictionaries for any other language than English when performing sentiment analysis. In addition, when you publish your Power BI Desktop file with Python transformations, you need to set up a gateway. The enterprise gateway doesn’t support Python scripts so you must install a personal gateway on the machine that was used to develop the Power BI Desktop file.
As a last caveat, note that Power BI Desktop “Enhanced Dataset Metadata” feature (currently in preview) doesn’t support R and Python scripts yet. So, if Power Query Preview Pane works but you get an error when importing your data in Power BI Desktop, you’ve probably turned this feature on. To resolve, turn it off and then create a new Power BI Desktop file.
https://prologika.com/wp-content/uploads/2016/01/logo.png00Prologika - Teo Lachevhttps://prologika.com/wp-content/uploads/2016/01/logo.pngPrologika - Teo Lachev2020-04-22 17:45:412020-04-22 17:47:56Sentiment Analysis with Power BI
Do you know that according to Gartner, at least five of the top 10 technology trends for 2020 will involve predictive analytics? And the third on the list is “democratization” to deliver it to non-specialists. With the growing demand for predictive analytics, Automated Machine Learning (AutoML) aims to simplify and democratize predictive analytics so business users can create their own predictive models. The promise of AutoML is to bring predictive analytics to business users, just like Power BI democratizes data analytics, Power Apps democratizes app dev, and Power Query democratizes data shaping and transformation.
Comparing Options
As a business user, the two most popular options for applying Automated Machine Learning for predictive analytics are Power BI and AzureML. Behind the scenes, Power BI AutoML uses the automated machine learning feature of AzureML but there are differences and I summarize below the most important ones.
Power BI AutoML
Azure AutoML
Licensing
Power BI Premium
Azure ML (Enterprise Edition recommended)
Container
Dataflow
Experiment
Power Query
Available
Not available
Supported data sources
Many
A few (local files, Azure SQL DB, ADLS, and a few more)
Model
Not Accessible (Power BI handles everything)
Accessible
Web service endpoint
Not available outside Power BI
Available for app integration
Scoring
Apply the model to entity
Various options (Notebooks, SDK, custom integration)
To me, the best solution would have been the combination of both technologies. I like Power Query for sourcing, shaping and transforming the data, but I also like the flexibility that AzureML brings. Unfortunately, you can’t mix and match. It appears that AzureML has decided to roll out their own data connectivity mechanism and as a result, it supports a limited number of data sources (for example, on-prem data sources are not accessible). I expect this to change as the product evolves.
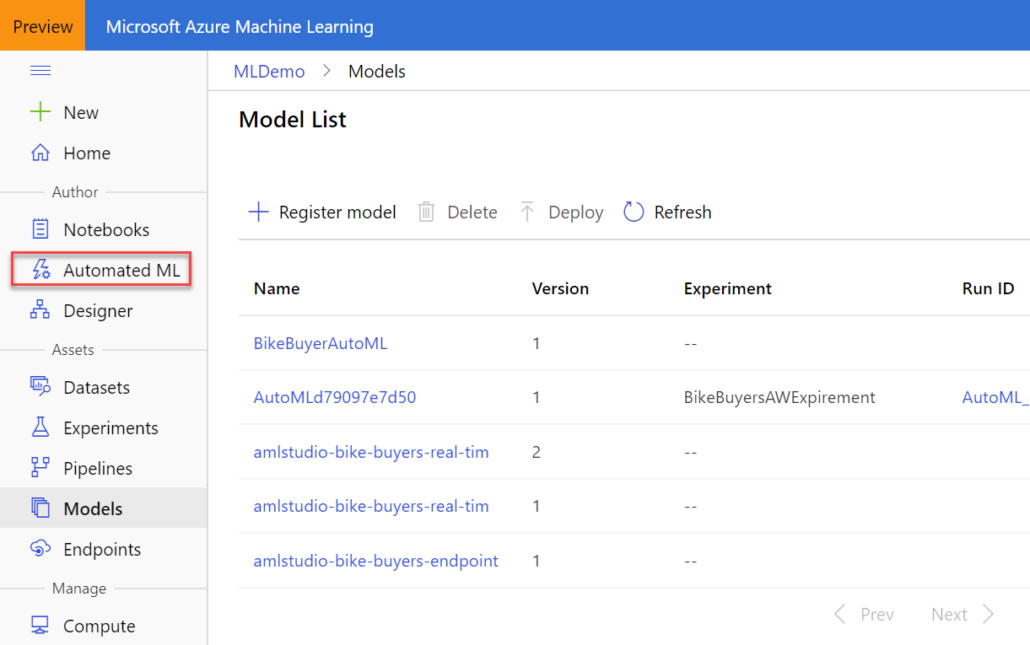
Azure ML Studio
I’ve done recently some work with the new version of Azure ML Studio (https://ml.azure.com/), and I’m impressed. Microsoft has learned important lessons from the previous AzureML (now called “classic”) and greatly enhanced the product. If you’re looking for a SaaS ML toolset that targets both business users and data scientists, AzureML should be on the top of your list. Speaking of its AutoML feature, the main advantages that it brings for predictive analytics are:
Determining the model type – classification, regression, and time series forecasting (the last one is not available yet in Power BI)
Automatic featurization
Selecting the best algorithm – For example, the screenshot below shows how AzureML has tested various algorithms and determined that VotingEnsemble performs the best.
Even if you’re a data scientist, the best algorithm selection feature alone justifies giving AutoML a try – if not for anything else but to select the best algorithm so that you don’t have to spend enormous time testing different algorithms.
Organizations are showing increased interest in predictive analytics. A large retailer that is using Azure Machine Learning (or AzureML) has approached me to help them automate the process. I can’t help it but compare AzureML with the Analysis Service Data Mining each time I look at it. It looks like both Microsoft and I agree at this point, that what used to be difficult was made simple and vice versa. On the upside, AzureML provides business users with a cloud environment for creating predictive solutions without involvement from IT. AzureML has more features than SSAS Data Mining. Now that the focus is on the cloud, we probably won’t see future investments from Microsoft in SSAS Data Mining (and the Excel data mining add-in for that matter) which is currently limited to nine algorithms. By contrast, not only has AzureML many more algorithms but also it allows users to use R and Python, create workflows, and enjoys a vibrant community that is eager to contribute samples. So, AzureML to predictive analytics is what Power BI is to descriptive analytics. It’s all about democratizing analytics to anyone who needs it.
On the downside, operationalizing AzureML predictive experiments has left some room for improvement. True, it’s very easy to promote your experiment as a web service that can be called in a singleton (one row at the time) or batch manner. The Excel Azure Machine Learning Add-in makes it easy to call the service as singleton or batch if your data lives in Excel and user interaction is acceptable. The Chapter 10 source code of my Applied Power BI book demonstrates how a Power BI model can call a predictive service as singleton and the steps are explained in the book. However, automating this process is much more difficult. Previously, all it was required to periodically retrain an SSAS data mining model was to schedule a job with the SQL Server Agent. By contrast, simply scheduling an AzureML experiment for retraining is currently not an option. You need to integrate with the experiment’s web service either programmatically or by using Azure Data Factory. Similarly, scoring the model in a batch mode (instead of singleton execution), requires calling the batch web service endpoint. Consequently, this requires either custom code (see the Microsoft Azure Machine Learning Samples on CodePlex) or using an Azure Data Factory pipeline. Either of these scenarios would require an intervention from your fellow programmer or Azure Data Factory expert. By contrast, SSAS data mining models can be queried with DMX which is easy but promoting them to the outside world requires custom coding.
Here is a diagram of an Azure Data Factory pipeline that I implemented to demonstrate scoring an AzureML model in a batch execution mode using data from a stored procedure residing in an on-premises SQL Server. In this case, my AzureML predictive experiment returns the probability of a customer to purchase a product although what the experiment does is irrelevant as far automation is concerned.
The high-level steps to automate the process are:
Create a NewCustomers dataset (table) that represents the output of the stored procedure for the new customers that you’ll predict on. Because in this case we’re sourcing data from an on-premises server, we have to install (you guess it) a Data Management Gateway, which you can download from your Azure Data Factory service in the Azure portal. As of now, this gateway is not the same as the Power BI Gateway that is used also by PowerApps, Microsoft Flow and Azure Logic Apps, mind you.
Because the predictive batch service requires an input, use the Copy Activity (blessed be the ADF team for adding it!) to save the results of the stored procedure to Azure Storage as an CSV file with headers.
Use the AzureMLBatchExecution activity to pass the file to the batch endpoint of the predictive experiment.
Save the predicted results from the predictive service as a file in Azure Storage and do whatever is needed with the results.
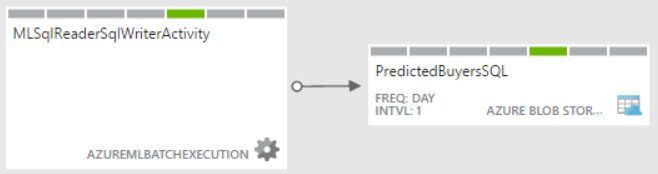
If the experiment gets the input data from Import Data (formerly known as a Reader), such as from on-premises or Azure SQL table, you can simplify scoring and retraining the model by creating a simple Azure Data Factory pipeline that has only the AzureMLBatchExecution activity. In this case, the activity passes no input to the web service and if the experiment writes to a database, no output is needed either. However, because the pipeline definition requires an output, I still had to create a dummy Azure Storage dataset (PredictedBuyersSQL) although not files will be sent to it.
Here is what the simplified ADF pipeline may look when the experiment reads and writes to a database.
AzureML will play an increasingly important role with predictive analytics on the rise. I hope the next release of AzureML would simplify operationalizing predictive experiments so that it doesn’t require programming effort or involvement from IT. Now that AzureML supports importing data from on-premises SQL Server and other cloud data sources, it should be simple to automate retraining and scoring models.
https://prologika.com/wp-content/uploads/2016/01/logo.png00Prologika - Teo Lachevhttps://prologika.com/wp-content/uploads/2016/01/logo.pngPrologika - Teo Lachev2016-09-09 16:04:322016-09-21 22:16:54AzureML – Current State of Affairs


 Do you know that according to Gartner, at least five of the top 10 technology trends for 2020 will involve predictive analytics? And the third on the list is “democratization” to deliver it to non-specialists. With the growing demand for predictive analytics, Automated Machine Learning (AutoML) aims to simplify and democratize predictive analytics so business users can create their own predictive models. The promise of AutoML is to bring predictive analytics to business users, just like Power BI democratizes data analytics, Power Apps democratizes app dev, and Power Query democratizes data shaping and transformation.