Posts

Integrating Power View with PerformancePoint

With the rising popularity of Power View, you may need to integrate it with PerformancePoint to jazz up your dashboards and make them more interactive. Take a look at the following, admittedly unpolished, dashboard which combines a PerformancePoint scorecard and Power View report.
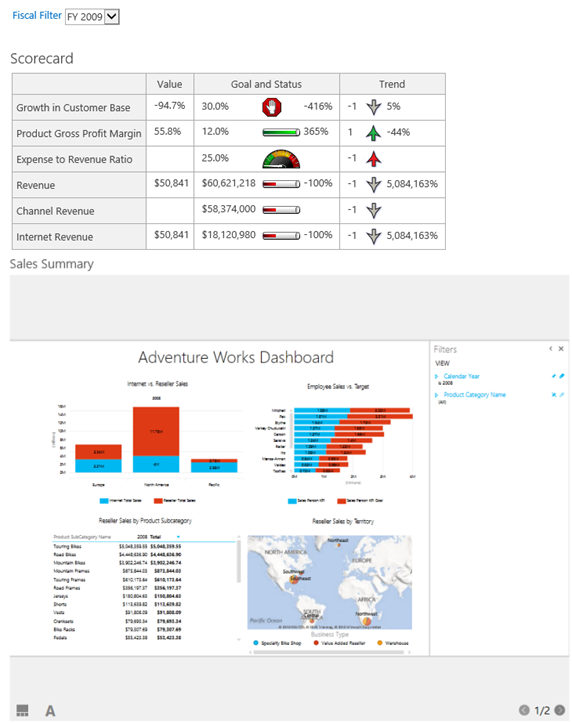
091513_0145_Integrating1

What’s interesting is that the Power View report is synchronized with the dashboard filter. For example, when the user changes the filter to 2009, the Power View report filters on the same year. Starting with SQL Server 2012 SP1 CU4, Power View supports passing URL parameters using the syntax rf=[Table].[Field] eq Value. In this case I use the following Power View URL:

http://<site>/_layouts/15/ReportServer/AdHocReportDesigner.aspx?RelativeReportUrl=/PowerPivot Gallery/Adventure Works Dashboard.rdlx&ViewMode=Presentation&PreviewMode=True&PreviewBar=False&[Date].[Calendar Year] eq 2009

As you would quickly discover, the Power View customization is rather basic. The only operator supported for now is the equal operator (eq) and multi-valued parameters are not supported. The PerformancePoint integration is achieved by using the Web Page report type. Because of the mechanics of how PerformancePoint passes a parameter to a web page report (it always appends the Endpoint_Url query string containing the filter value), you’ll need a wrapper ASP.NET or HTML page that extracts this parameter and constructs the correct Power View URL. I opted for an ASP.NET page. Due to the SharePoint limitation that ASP.NET pages cannot have code-behind files, the PowerViewWrapper.aspx page, which I added to the Pages folder, includes the server side code:

<!DOCTYPE html PUBLIC “-//W3C//DTD XHTML 1.0 Strict//EN” “http://www.w3.org/TR/xhtml1/DTD/xhtml1-strict.dtd”>

<script runat=”server”>

protected void Page_Load(object sender, EventArgs e) {

System.Collections.Specialized.NameValueCollection nvc = HttpUtility.ParseQueryString(Request.Url.ToString());

string filterValue = nvc[“Endpoint_URL”];

if (filterValue == null) return;

string pvUrl = String.Format(“http://elitevm1/bi/_layouts/15/ReportServer/AdHocReportDesigner.aspx?RelativeReportUrl=/bi/PowerPivot Gallery/Adventure Works Dashboard.rdlx&ViewMode=Presentation&PreviewMode=True&PreviewBar=False&rf=[Date].[Calendar Year] eq {0}”, filterValue.Remove(0, 3)); // remove “FY “.

Response.Redirect(pvUrl); }

</script>

Note: By default, SharePoint disallows custom code and the page will error out with “Code blocks are not allowed in this file”. To fix, this open C:\inetpub\wwwroot\wss\VirtualDirectories\80\web.config and change the PageParserPaths section as follows (allowing all pages with /* was the only way I was able to get the page to execute successfully:

<PageParserPaths>

     <PageParserPath VirtualPath=/* CompilationMode=Always AllowServerSideScript=true IncludeSubFolders=true/>

</PageParserPaths>

 The last part is to hook the Web Page report to the dashboard (no surprises here):

  1. In the PerformancePoint Designer, add a Web Page report with an URL pointing to the wrapper page, such as http://<site>/bi/Pages/PowerViewWrapper.aspx?Dummy=1 (the Dummy parameter was added so ParseQueryString could parse the query parameter in the wrapper page).
  2. Add the report to the dashboard.
  3. Drag the Display Value property of the filter and drop it onto the Web Page report zone.
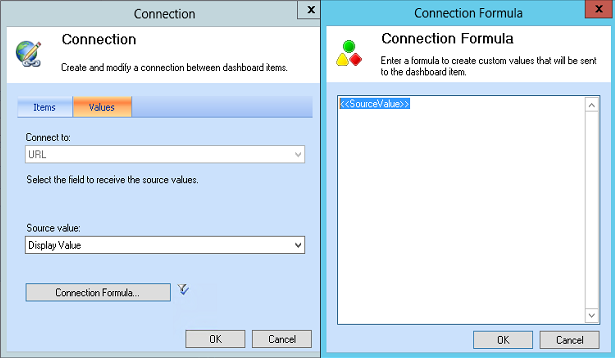
  4. In the Connection dialog box, click the Connection Formula button and configure it as follows:

    091513_0145_Integrating2

The <<SourceValue>> placeholder returns the filter value, which PerformancePoint passes to the wrapper page, which in turn calls the Power View report.

PerformancePoint Display Condition Not Working

Issue: A client reports an issue with our PerformancePoint dashboard where the clicking a KPI in the scorecard doesn’t show the supporting analytical grid. Normally, when the user clicks a row in the Operational Scorecard (see the image below), the SharePoint connectable architecture triggers an update of the Operational Detail Report Months analytical report that shows more details about the selected KPI.


Workaround: Finding the cause was tricky. To make things even trickier, the SQL Server Profiler would show “Query (1, 36) Parser: The syntax for ‘,’ is incorrect.” error so you would believe that there is something wrong with the MDX queries. This turned out to be an “innocent” error if there is such a thing. The reason for the issue with the report refresh not working was actually a PerformancePoint Display Condition bug presumably introduced by a recent SharePoint upgrade (more than likely the April CU). The display condition actually works if you put the page in Edit mode. While waiting for a fix from Microsoft, the workaround I found is to enable a default display condition:

  1. Open the dashboard in the Dashboard Designer.
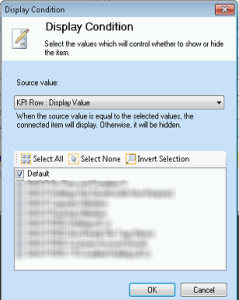
  2. In the Analytical Report web part, right-click the Display Condition and then Edit Condition.
  3. Check the Default checkbox and redeploy the dashboard.

070313_1254_Performance2

This displays the default configuration of the Analytical Grid report which the user will see when opening the dashboard page. For some reason, this makes the KPI row clicks work. Sometimes, things get worse before getting better…

PerformancePoint 2013 Dependencies for Analysis Services

Besides the usual hassle configuring PerformancePoint, including insufficient permissions to databases and service accounts, version 2013 requires the SQL Server 2008 R2 drivers. This is surprising considering that SharePoint 2013 shipped after SQL Server 2012.

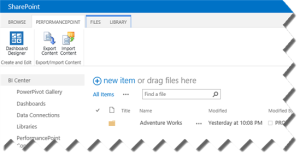
In a previous blog, I explained how to configure the SharePoint 2013 BI Center. When you go to any of the PerformancePoint-related links, such as Dashboards or PerformancePoint Content, you’ll see the following ribbon.

5076.ppt%20ribbon.png-550x0

The Dashboard Designer button is the new way to launch the PerformancePoint Designer. However, when you attempt to configure a data source pointing to Analysis Services, you will likely get an error. The first stop for troubleshooting SharePoint and PerformancePoint issues is of course the Windows Event Log. If you examine the Windows Event Log, you’ll see that PerformancePoint fails to load the 10.0 version of Microsoft.AnalysisServices.AdomdClient. This is the version that’s included in SQL Server 2008 R2. This sends you to the SQL Server 2008 R2 Feature Pack page, from where you can download and install the Microsoft SQL Server 2008 R2 ADOMD.NET library. Now, you can connect to Analysis Services.

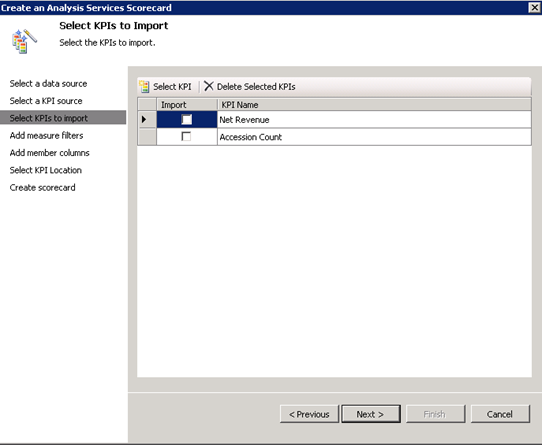
The next trip to the SQL Server 2008 R2 Feature Pack page will happen when you try to import (not create) KPIs defined in an Analysis Services cube. This time the error in the Event Log indicates that PerformancePoint requires the 10.0 version of the Microsoft.AnalysisServices dll, which represents the Analysis Services Management Objects (AMO). Back to the SQL Server 2008 R2 Feature Pack, you need to download and install Microsoft SQL Server 2008 R2 Analysis Management Objects. While you there, you might as well download and install Microsoft Analysis Services OLE DB Provider for Microsoft SQL Server 2008 R2 although I don’t think PerformancePoint uses it.

What’s New in Office 2013 BI: Part 5 – New Features in PerformancePoint 2013

I’d delegate this one to the PerformancePoint 2013 blog, where Kevin Donovan, Microsoft Program Manager, nicely addresses PerformancePoint speculation, confusion and misinformation while also introducing what is new in detail.

Upgrade Issues with PerformancePoint 2010 Filters

Issue: Migrate a PerformancePoint dashboard from MOSS 2007 to SharePoint 2010. We used the Import PerformancePoint Content feature to import existing dashboards from the PerformancePoint database and this saved us a lot of effort. However, filters failed with this rather obscure error:

121611_0116_UpgradeIssu1

After tracing with SQL Profiler and looking at the Windows Event log, we saw the following almost as useless error):

Microsoft.AnalysisServices.AdomdClient.AdomdErrorResponseException: Query (1, 7) Parser: The syntax for ‘{‘ is incorrect.

In this case, the dashboard is using a Time Intelligence filter mapped to an Analysis Services dimension.

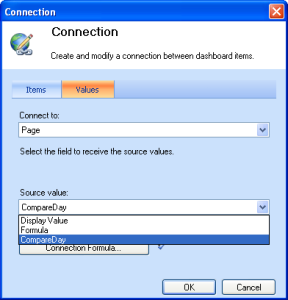
Resolution: The upgrade process has mapped the filter’s formula in the connection to the scorecard. We fixed the issue by mapping the filter data source (not formula), as shown in the screenshot below. In this case, the CompareDay is the data source name.

121611_0116_UpgradeIssu2

Dundas Dashboard and PerformancePoint Comparison Review

Digital dashboards, also known as enterprise dashboards or executive dashboards, are rapidly rising in popularity as the presentation layer for business intelligence. The chances are that you’ve been asked to implement a dashboard to let management quickly ascertain the status (or “health”) of an organization via key business indicators (KPIs) and this task might seem daunting. This is where Dundas Dashboard can help.

As a leader in data visualization solutions, Dundas has given us great products that power many business intelligence solutions, including Microsoft Reporting Services and .NET charting. Its latest offering, Dundas Dashboard 2.5, lets you implement compelling dashboards quickly and easily. Since my career focus has been Microsoft Business Intelligence, I was curious to evaluate the capabilities of Dundas Dashboard and compare them with Microsoft PerformancePoint 2010.

Read the full review here.

Importing SSAS KPIs in PerformancePoint

Forging ahead through the unchartered land of PerformancePoint 2010, I ran into a snag today. Attempting to import Analysis Services KPIs resulting in the following error:

An unexpected error occurred.  Error 47205.

Exception details:

System.IO.FileNotFoundException: Could not load file or assembly ‘Microsoft.AnalysisServices, Version=10.0.0.0, Culture=neutral, PublicKeyToken=89845dcd8080cc91’ or one of its dependencies. The system cannot find the file specified.

File name: ‘Microsoft.AnalysisServices, Version=10.0.0.0, Culture=neutral, PublicKeyToken=89845dcd8080cc91’

   at Microsoft.PerformancePoint.Scorecards.Server.ImportExportHelper.GetImportableAsKpis(DataSource asDataSource)

   at Microsoft.PerformancePoint.Scorecards.Server.PmServer.GetImportableAsKpis(DataSource dataSource)

Since in our case, PerformancePoint was running on a SharePoint web front end server (WFE) which didn’t have any of the SQL Server 2008 components installed, it was clear that PerformancePoint was missing a connectivity component. Among many other things, I tried installing the Analysis Services Management Objects (AMO) from the SQL Server 2008 Feature Pack but the error won’t go away. I fixed it by running the SQL Server 2008 setup program and installing the Client Tools Connectivity option only. Then, the KPIs magically appear in the Scorecard Wizard.

090710_1533_ImportingSS1

PerformancePoint 2010

PerformancePoint? Is it still around? It is (in SharePoint 2010), and it should peak your interest if you are serious about dashboarding. The planning component is of course gone and I have to admit I never had too much faith in it. When comes to dashboards, Microsoft gives you two implementation options:

  1. Reporting services reports in SharePoint web parts – Pros include low cost because Reporting Services is available with SharePoint Foundation, and no need to learn new skills. On the downside, you need to implement your own global filter web parts assuming that you don’t use SharePoint Server.
  2. PerformancePoint – This is tool specifically designed for dashboards and it just got better in SharePoint 2010. However, it requires SharePoint Server 2010 which you need for PowerPivot as well. Unfortunately, this puts you in the $5,000+ upfront investment bucket (Vidas has more to say about SharePoint pricing).

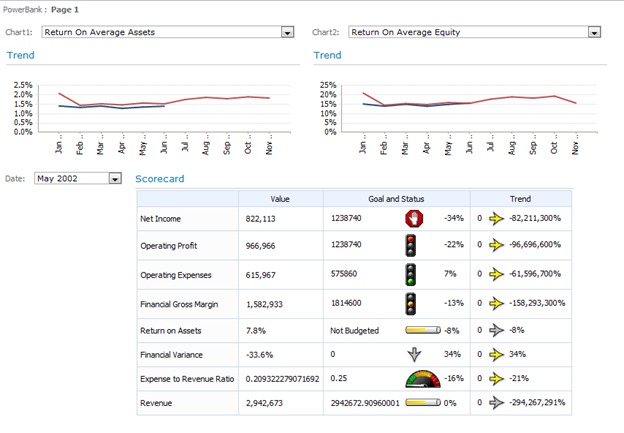
Personally, I was pleasantly surprised when I re-discovered PerformancePoint in SharePoint 2010. Here is a cool little dashboard I put together in a couple of hours after importing the Adventure Works KPIs.

090310_0251_Performance1

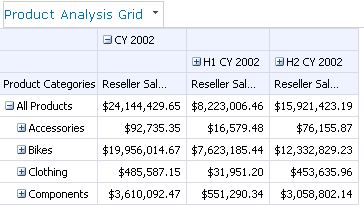
I’ve been complaining for a while that Microsoft doesn’t have a web-based OLAP browser. PerformancePoint reporting capabilities (chart and grid) come pretty close. Below is a grid report bound to the Adventure Works reseller data. It would be really cool if PerformancePoint continues the trend to fill in the gap and adds more Excel-like features, such as filters, slicers, etc.

090310_0251_Performance2

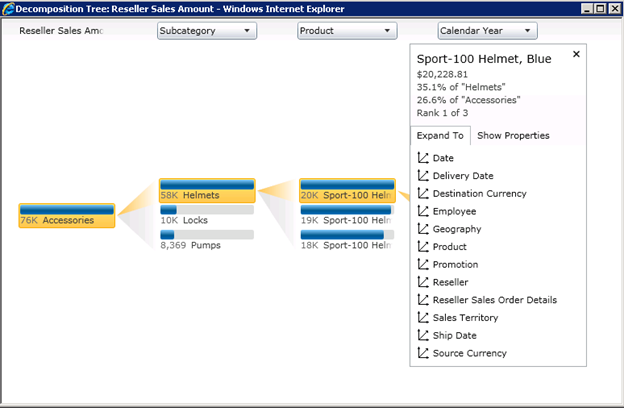
Yes, we now have the ProClarity remnants in the form of a Silverlight-based decomposition tree (requires Silverlight 3.0 on the client). To get it, I right-clicked a cell on the report and clicked Decomposition Tree. This lets me analyze sales by any dimension.

090310_0251_Performance3

So, what’s the catch except the cost? The ridiculously difficult Kerberos configuration of course if you have a multi-server environment. In our case, just when we thought we conquered the Kerberos beast with SSRS, we’ve found the PerformancePoint doesn’t work. As it turned out, unlike Reporting Services, PerformancePoint requires a constrained delegation and uses the Claims for Token service. So, follow the steps in the Configuring Kerberos Authentication for SSRS 2008 R2 with SharePoint 2010 whitepaper closely.

If you have SharePoint 2010 Server already, PerformancePoint definitely warrants your interest.