Why Business Like Yours Choose Power BI Over Sisense
As Power BI gains a momentum, expect attacks from vendors to intensify. Do you know that there are thousands of vendors offering BI tools! There is not a month passed by when I’m not asked about some cool vendor. I usually don’t criticize other vendors but sometimes I get provoked by their audacity and I need to keep ’em honest. Recently, a customer shared a Sisense whitepaper “Why Business Like Yours Choose Sisense over Power BI” and asked about my thoughts. The whitepaper is not published yet but I guess it will be soon as Sisense has deployed another battle card “Why Business Like Yours Choose Sisense over QlikView” that’s already in the open. Overall, Sisense appears to be a just another pure self-service BI player that it’s trying to aggressively get noticed and refuses to see further then its nose. Judging by their mantra on YouTube and elsewhere, data warehousing is dead, OLAP is dead, star schema is dead, as well as pretty much everything else except Sisense. In their own words:
“DO I NEED TO BUILD A DATA WAREHOUSE?”
Absolutely not! Data warehouses are one of the most notorious projects associated with BI tools. That’s exactly what we have vowed to eliminate. We use an in-memory columnar database that automatically connects to your data and builds everything for you. You do not need to worry about a complex data modeling or performance. You just say which data you want to add, and Sisense does the rest.
Dream come true? Actually, nothing new here despite their Don Quixote’s rhetoric. If your BI solution can be done just by joining a bunch of tables, you can do it with any self-service BI tool, as folks have done for many years using Excel, Access, and for the past decade other self-service BI oriented tools. A tool that allows you to just import more data doesn’t solve the inherent problems of self-service BI. Complex data transformation, automation, and consolidation requires a centralized repository. When done right and if you need it, implementing DW shouldn’t be risky, and it should yield a nice ROI together with a true single version of truth. As I said many times, any vendor or a consulting firm that forces you in a particular methodology (pure self-service BI in this case), is just trying to score points and it shouldn’t be taken seriously. There isn’t one-size-fits-all tool or methodology when it comes to data analytics.
Let’s take a look at some of the statements that Sisense makes about Power BI and Sisense offerings. I actually installed their 15-day trial and did some limited testing. Mind you that their whitepaper is limited to comparing the self-service aspect of Power BI with Sisense because they don’t have organizational BI solution (which of course they hold in disdain). So, we’re comparing just Power BI Desktop self-service models and PowerBI Service with Sisense ElastiCube and dashboards. Let’s review some of the claims Sisense makes:
-
“Power BI is a good out the box tool for simple data analysis, but if you need to analyze larger and more complex data you will likely need to invest in a costly high performance data store. Why? Because of the MS data and technology limitations to query larger or complex data sets, Power BI requires a direct query to the data. If you want the query to run fast or to scale, their lack of a high performance data engine creates 3 issues:
- You need expensive technical skills to get the data properly prepared for analysis in the data store.
- If you do not have a powerful data store, you need to invest in it.
- Business will be more reliant on IT to prepare data, which will create more, not less overhead and longer time to value.”
Sisense is exalting the virtues of ElastiCube as superior to xVelocity (the memory engine behind Power BI Desktop/Power Pivot, Tabular and SQL Server columnstore indexes). SiSense ElastiCube is a proprietary multidimensional storage that is only accessible by Sisense dashboards. Think of ElastiCube as SSAS Tabular but simplified to target business users. Of course, simplification comes at expense of features. However, its storage is disk first, memory second, and it brings data in memory on demand (so think of it as a hybrid between Multidimensional and Tabular). Sisense claims that this architecture is highly scalable and superior to both OLAP and in-memory columnar databases. However, similar to the SSAS default cached storage, ElastiCube requires that all the data must be imported first. I don’t see a pass-through configuration where ElastiCube can pass queries to a fast database. Direct Query, of course, is mentioned as a limitation of Power BI while it should be the other way around. As far as scaling without a backend data store that is sanctioned by IT, I kept on asking myself “How many business users out there have access to billions of rows?” (that need to be imported, mind you!). To Sisense’s point, i
t’s true that PowerBI.com now limits the datasets you upload to 250 MB(expect this limitation to be lifted) but this 250 MB still allows you to pack a few million rows because data is highly compressed. Anyway, if your business users need to import billions of rows without IT getting involved and data doesn’t require extensive transformations, then Sisense might be worth a try but you probably shouldn’t be on the self-service bandwagon with these data volumes to start with. As far as complex data, I found Sisense to be no match to xVelocity and DAX as you’ll quickly find out when you start modeling with Sisense ElastiCube Manager and look at the limited calculations and relationship options the tool supports.
UPDATE 5/16/2016 – Microsoft increased the max file size to 1 GB; UPDATE 7/115/2017 – Power BI Premium has further increased the dataset size to 10 GB. - Dashboard filtering in Power BI – “Limited access pre-defined by dashboard creator using ‘slicer’ widgets”. Power BI supports visual-level, page-level, and report-level filters which Sisense obviously missed. Power BI support basic and advanced filtering modes. Interestingly, when I played with Sisense, their filtering options filters data before it’s aggregated.
- Widget drilldown in Power BI – “Only supported in Power BI Desktop, pre-defined by dashboard creator”. Another wrong statement. Users can create ad-hoc reports and they have the same reporting capabilities as in Power BI Desktop.
- “To avoid direct queries against data, Power BI Desktop uses a Memory intensive data engine with some data compression – this has all the disadvantages of the in-memory approach relating to performance limitations (you can’t get large data sets into memory) and cost to scale (memory is expensive).” – This goes back to the first point. I’m yet to see business users who are given rights and authority to analyze billions of rows, not to mention the performance implication of importing such a enormous dataset (the only option supported by ElastiCube). And, Power BI compresses everything so the statement “some data compression” is technically inaccurate.
- “Applying changes to an existing data model, for example adding or editing a column is like starting from scratch as the model will have to do all the data import and transformations again – very time consuming” – Nope. The Power BI engine is smart enough to apply the minimum processing. If you add a column, it will reload only that table. Not sure what Sisense means by “editing”, since the data is read-only but renaming the column is only a metadata operation and it’s very quick.
- “The Query Editor has a wizard feel, but it somewhat complex and clunky” – What’s the Sisense alternative that is not complex and clunky for data transformations by business users? Power Query resonates very well with business users and I don’t agree with this statement but beauty is the eye of the beholder.
- “In practice, if analytics are to be done on a larger, more complex data set, much care must be taken to pre-aggregate and clean the data to fit into the data size limitations.” – I don’t see how Sisense would address more complex data. More complex data would probably require an organizational BI solution which they don’t support.
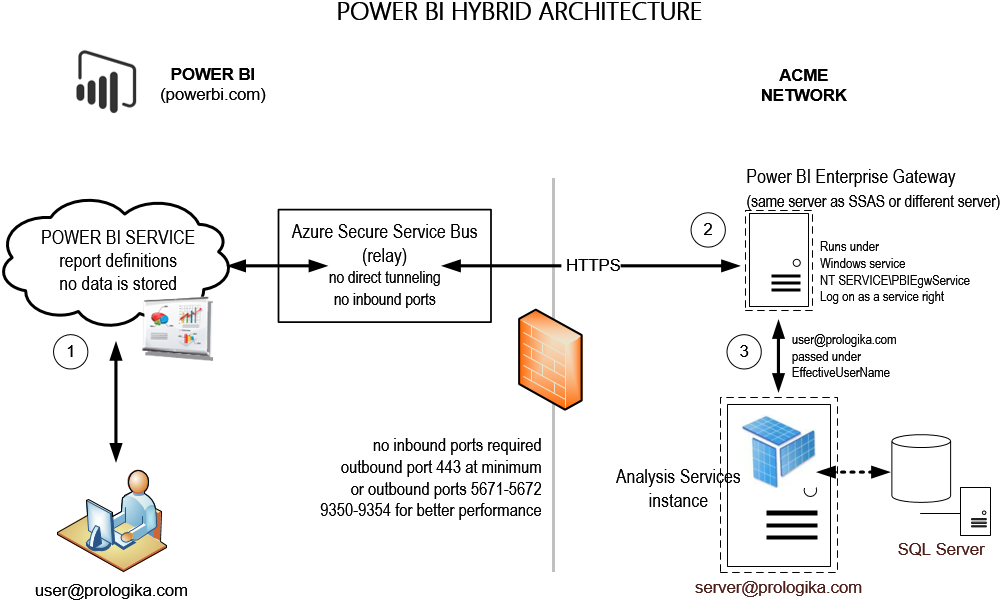
- “However as data complexity and requirements generally grow as users’ appetites for more analytics and intelligent dashboards, problems will quickly arise due to the strict data limitations of Power BI.” Would you want your business users to manage complex solutions? Are they actually capable of doing so? If they are, Microsoft gives you a nice continuum where you can move the solution to a dedicated server. True, the modeler needs to learn a few more tricks and get out of Power BI Desktop/Excel and into Visual Studio, and gain many more features than Sisense provides.
- “Sisense can deploy to a cloud hosted service, or to an on premise server, while Power BI currently only offers a cloud hosted solution for sharing.” From here, we learn that Sisense Cloud is actually VM-hosted. So, no PaaS. You still have to configure it, manage it, license it, etc.
- “You will lose the ability to perform analytics on larger data sets, and will need to make decisions to pre-aggregate data in a data warehouse, or drop portions of the dataset in order to adhere to the data size limits.” We typically don’t pre-aggregate data as we have efficient backend technologies to aggregate it for us.
- “In Sisense, you will have a much more flexible, scalable solution that can be maintained much more easily by less technical resources.” – This goes back into the self-service mantra. Large, complex, and scalable solutions are often needed and it’s too much to ask of business users to tackle them.
Of course, Sisense leaves out many other points and features Power BI excels. Q&A? Quick Insights? Excel integration? Security? Governance? Sharing? Speed of development? Real-time BI? Machine Learning? Pricing – for this, you need to call Sisense.
In summary, why Business Like Yours Choose Power BI Over Sisense? Because Sisense is two quadrants behind (it made the Magic Quadrant this year). Read the latest Gartner report to find what Gartner thinks about Sisense (tip: you can download the report from the Sisense site).