Posts

Introducing Office Online Server

Continuing the line of thought from my previous blog “Microsoft Unveils BI Roadmap”, one nagging question still remains. What to do with all these Excel files now that SSRS came with a vengeance and has been promoted to THE on-premises BI platform? It looks like Microsoft is thinking along these lines. Interestingly, Excel Services will be removed from SharePoint Server 2016 and replaced with Office Online Server, as explained here. And this page gives more details about Office Online Server which is currently in preview. In a nutshell, Excel rendering would work pretty much in the same way as in SharePoint Server 2013. The most common scenario that Microsoft plans now is to have the Excel workbook in SharePoint. When you open the workbook, SharePoint will redirect you to the Office Online Server using a WOPI frame (some sort of an Iframe), with some special tokens that enable Office Online Server to retrieve the workbook from SharePoint, and then render it as usual. This will work for Power Pivot models as well. Office Online Server (OOS) also supports loading Excel files from OneDrive which is how Power BI Excel rendering works today.

But wouldn’t be nice to extend SSRS 2016 and integrate with OOS so that you can deploy Excel reports to a report server installed in native mode? This would allow SSRS to handle all of the important Microsoft report formats (SSRS, Datazen, Power BI Desktop, and Excel). If OOS doesn’t require a SharePoint license, this will be a great value proposition as well as you will save you a SharePoint Server Enterprise Edition license. This is precisely the wish I communicated to Microsoft and posted it on the Excel wish list. Please vote if you like the idea.

You know that there is an Excel wish list site, right?

SSRS Style Templates

As you probably know, the SSRS Report Wizard allows users to select predefined report styles. These styles are basic “skins” that apply to report foreground and background colors.

3124.styles.jpg-550x0

A question came in from a student as to how to modify/add styles. You can alter the existing style templates or add new ones by editing the StyleTemplates.xml file in the \Program Files (x86)\Microsoft Visual Studio 10.0\Common7\IDE\PrivateAssemblies\Business Intelligence Wizards\Reports\Styles\<language> folder. You need to make this change on the client machine where SSDT is installed.

On the subject of styles, recall that starting with SQL Server 2008 R2, SSRS supports report parts to promote report reuse and reduce maintenance.

How to Test SSRS Data Alerts without Corporate Mail Server

Reporting Services data alerts were introduced in SQL Server 2012 to allow business users to receive e-mail notifications based on rules they specify. Data alerts require SSRS to be configured in SharePoint integration mode. However, you’d probably run SharePoint on a VM for development and demo purposes and you might not have access to a functional mail server. The following steps allow you to configure your VM to test data alerts with a local SMTP server:

  1. Assuming your SharePoint VM is running Windows Server 2012, open Turn Windows Features On and Off and add the SMTP Server feature. This will install a local SMTP server.
  2. Open IIS Manager 6.0 and start the SMTP Virtual Server. Configure the SMTP server to allow relay.
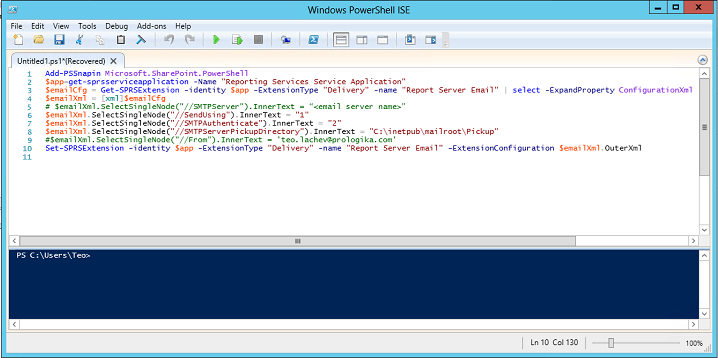
  3. Because SSRS 2012 integrates natively with SharePoint, you can’t use the report server configuration files to directly change the SSRS settings. Instead, you must use PowerShell as I explained here. Open Windows PowerShell ISE and execute the following script to configure the SSRS e-mail settings. Replace <your SSRS application name> with the name of your SSRS application which you can obtain from the SharePoint Central Administration ð Manage Service Applications. Execute the script.

    051014_2250_HowtoTestSS1

    Add-PSSnapin Microsoft.SharePoint.PowerShell

    $app=get-sprsserviceapplication -Name “<your SSRS application name>”

    $emailCfg = Get-SPRSExtension -identity $app -ExtensionType “Delivery” -name “Report Server Email” | select -ExpandProperty ConfigurationXml

    $emailXml = [xml]$emailCfg

    # $emailXml.SelectSingleNode(“//SMTPServer”).InnerText = “<email server name>”

    $emailXml.SelectSingleNode(“//SendUsing”).InnerText = “1”

    $emailXml.SelectSingleNode(“//SMTPAuthenticate”).InnerText = “2”

    $emailXml.SelectSingleNode(“//SMTPServerPickupDirectory”).InnerText = “C:\inetpub\mailroot\Pickup” # You probably don’t need this; I was experimenting with dropping the messages to a pickup folder

    $emailXml.SelectSingleNode(“//From”).InnerText = ‘teo.lachev@prologika.com’

    Set-SPRSExtension -identity $app -ExtensionType “Delivery” -name “Report Server Email” -ExtensionConfiguration $emailXml.OuterXml

  4. If you haven’t configured the data alerts before, go to SharePoint Central Administration ð Manage Service Applications ð <Your SSRS Application>, and then click Provision Subscriptions and Alerts. If you have admin permissions to the SQL Server that hosts the SharePoint databases, enter your credentials and click OK to grant the SSRS service account access to the SQL Server Agent (the SQL Server Agent Service must be running for the data alerts to work). If you don’t, then click the Download SQL Script link and give the script to the DBA to execute the script in order to grant the SSRS service account these permissions.
  5. Now, create a data alert as usual and run it from the Manage Data Alerts page. After you manually run the alert, you shouldn’t see an error in the Status column.051014_2250_HowtoTestSS2
  6. Go to the SMTP service queue folder, the default one is C:\inetpub\mailroot\Queue. You should see files with extension *.EML. You can open these files with Microsoft Outlook to see the details of the e-mail notification that SSRS sends to the recipient. It should look like the one below. In this case, I’ve create a report that shows the status of the SharePoint timer jobs and I wanted to be notified every time the Status=3.

051014_2250_HowtoTestSS3

Pick List in SSRS

A customer is moving from Impromptu to SSRS. One of the SSRS missing features that was very important for this customer was the Imprompu pick list that allows users to copy a list of parameter values, such as a list entered in Notepad, to the parameter prompt. For example, the user might get a list of account codes via e-mail and this list may vary from day to day. Instead of hardcoding the list in the query WHERE clause or in the parameter default values, the user wants an easy way to copy and paste the parameter values.

Actually, SSRS supports this scenario just fine and without any custom coding on your part. You just need to add a multivalued parameter of type Text and code your SQL query to use an IN clause as usual. The attached report shows how this is done. Just copy the codes below and paste in the parameter to test the report.

AR-5381

BA-8327

BE-2349

BE-2908

[View:https://prologika.com/CS/cfs-file.ashx/__key/CommunityServer.Blogs.Components.WeblogFiles/blog/2313.Pick-List.rdl:550:0]


Passing Large Report Parameters

Scenario: A custom application needs to display a filter dialog to prompt the user to select accounts from a tree consisting of thousands of nodes, such as a tree that organizes the accounts in levels. Once the user makes the selection, the application passes the account list to a report parameter so that the report can show the data for the selected accounts only.

Issue: The filter list could get rather large. Even if the application follows the Excel filtering pattern to include only the parent node if no child nodes are selected, you might end up with a list consisting of hundreds, perhaps even thousands of accounts. However, Reporting Services has limits on the parameter size. When you test the report in the Report Designer, the report parameter is limited to some 32,000 characters. The Report Viewer doesn’t have this limitation so a string-type report parameter can deceptively take the entire list. However, a change was made in SQL 2012 to limit the parameter size during report rendering. Specifically, ParameterInfoCollection.ToUrl throws an exception “The value of parameter ‘param’ is not valid.” when a parameter value exceeds 65,520 characters. That’s because this method calls the .NET System.Uri.EscapeDataString method which has the 65,520 limit. Interestingly, the report query is executed but the error is thrown after the dataset is processed.

Resolution: What if you still need to pass a parameter value whose size exceeds 65,520 characters? Here are some options:

  1. Although not a solution, the easiest approach is prevention, such as to limit the user selection to 65,520 characters.
  2. Another option is to save the report value to a database and pass the table key to the report parameter. Then, the report query can join to the report parameter table. This approach may work well for relational reports but it doesn’t work so well with cube reports because you can’t join the cube to a relational table. You might try to default the report parameter to a database query that brings the report value from the database but you will still get the above error. For cube reports, one option might be to concatenate the report query text with the filter from the database. Another option could be to write an SSAS stored procedure that retrieves the filter from the database and generates an MDX set.
  3. Yet another option is to compress the report parameter. For example, MDX has a rather verbose notation. Instead of passing the member unique name, e.g. [Account].[Account Level 1].&[1000], consider collapsing the level name to |al1|.&[1000] and then expanding it on the report side by replacing the token with the attribute or level unique name. This approach may reduce the parameter list x10 and help you overcome the 65K limit.

Nevron Chart for Reporting Services

Nevron was kind enough to show me their chart and gauge for Reporting Services. In certain areas, their products exceed the charting capabilities of Reporting Services. Here are the highlights:

  1. The product provides support for SQL Server Reporting Services (SSRS) 2005, 2008, 2008R2 and SQL Server Data Tools (SSDT) 2012.
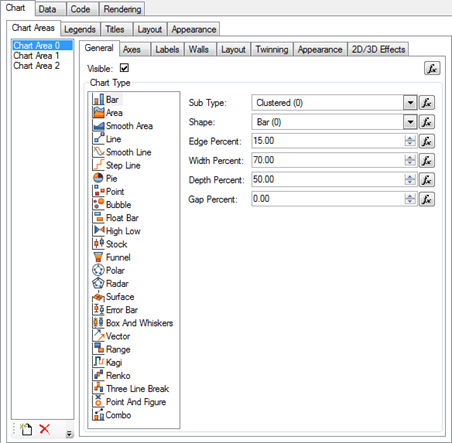
  2. Advanced Chart Designer021813_0226_NevronChart1
  3. Complete set of 2D and 3D Charting Types
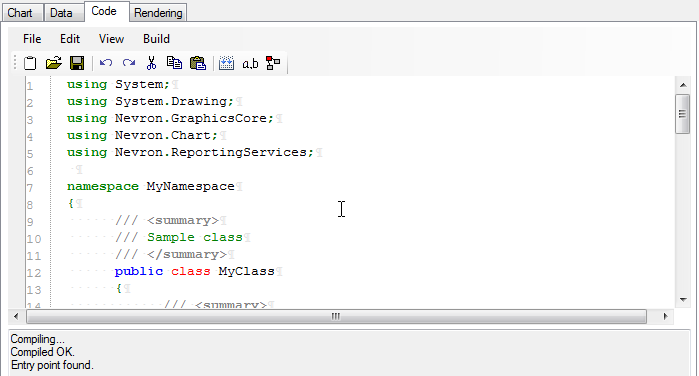
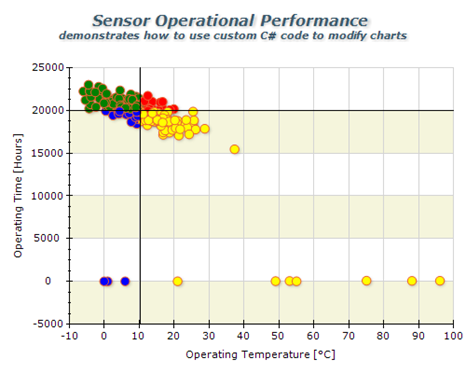
  4. Support for Code Customization – Nevron Chart for Reporting Services supports customization through C# code, which allows you to use the full Nevron Chart for .NET API in SSRS and achieve a higher degree of customization.

    021813_0226_NevronChart2021813_0226_NevronChart3

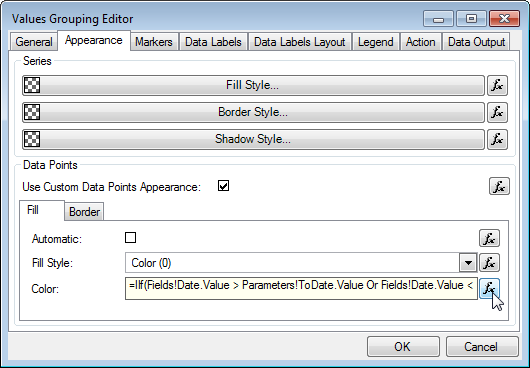
  5. Expressions Everywhere – Nearly all properties of the Chart report item can now be specified by expressions. Appearance styles (fill, stroke, shadow and text) are also reworked to support both constant specification and specification that is based on expressions. This allows you to bind nearly all configurable aspects of the report item to user defined parameters and/or data.021813_0226_NevronChart4
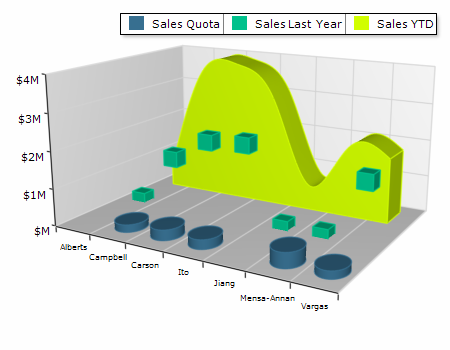
  6. Support for 2D/3D Combo Charts – Combo Charts are used to combine certain series types within the same chart area.021813_0226_NevronChart5
  7. XML Formatted Texts – This feature is applicable to all elements which display text. It allows you to mix fonts, mix bold, italic underline formatting and many other advanced features like different fill styles, shadows, image filters etc. – all inside a single label, title etc.021813_0226_NevronChart6
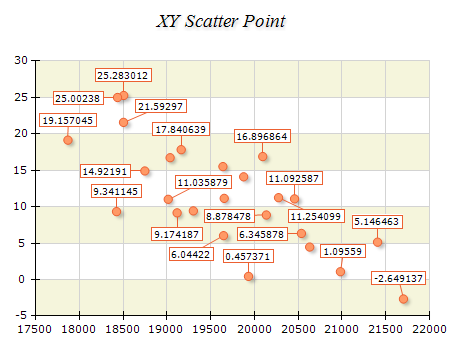
  8. Non-overlapping Data Labels Layout – All Cartesian Chart types support automatic non-overlapping data labels layout. The data label layout prevents labels from overlapping in both ordinal and scatter charts and works in 2D and 3D appearance modes.021813_0226_NevronChart7
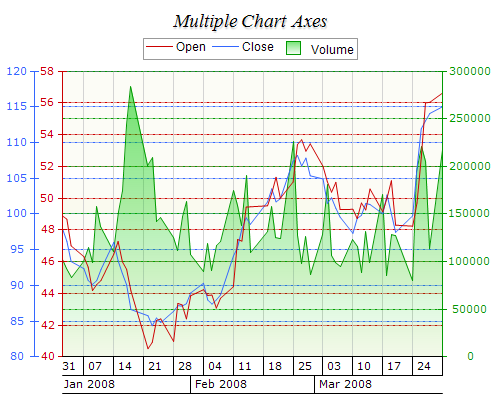
  9. Advanced Axis Model – complete set of axis-related features designed to target even the most compelling charting requirements.

021813_0226_NevronChart8021813_0226_NevronChart9021813_0226_NevronChart10


The online demo is available at: http://examplesssrsvision.nevron.com/


DAXMD Goes Public!

Microsoft announced yesterday the availability of the Community Technology Preview (CTP) of Microsoft SQL Server 2012 With Power View for Multidimensional Models (aka DAXMD). As a participant of the CTP program and I’m very excited about this enhancement. Now customers can leverage their investment in OLAP and empower business users to author Power View ad-hoc reports and dashboards from Analysis Services cubes. Previously, Power View supported only PowerPivot workbooks or Analysis Services Tabular models as data sources. I’m not going to repeat what T.K. Anand said in the announcement. Instead, I want to emphasize a few key points:

  1. This CTP applies only to the SharePoint-version of Power View. Excel 2013 customers need to wait for another release vehicle to be able to connect Power View in Excel 2013 to cubes.
  2. You’ll need to upgrade both the SharePoint server and SSAS server because enhancements were made in both Power View and SSAS.
  3. Although not supported, I successfully tested that you can install the CTP on top of SQL Server 2012 SP1.
  4. The CTP will not be upgradable to RTM.
  5. It’s not known at this point when and how the RTM bits will ship.
  6. DAXMD doesn’t translate DAX queries to MDX. Instead, the DAX queries are handled natively on the server and performance is awesome!

Kudos to the SSAS and SSRS teams for listening to customers and working together on this feature!

What’s New in Office 2013 BI: Part 2 – Power View Enhancements

[View:https://prologika.com/CS/cfs-file.ashx/__key/CommunityServer.Blogs.Components.WeblogFiles/blog/7762.Geography.xlsx:550:0]

Power View in Office 2013 brings the following new features:

  • Integration with Excel 2013 – Microsoft has decoupled Power View from SharePoint and included it in Excel so you can create ad-hoc reports connected to BI models, just like you can create pivot reports. I hope the PerformancePoint Decomposition Tree will follow suit.
  • New visualizations – This includes interactive and drillable geospatial maps and pie charts.
  • Better support of tabular models – Power View now supports key performance indicators (KPIs) and hierarchies.
  • Design and branding enhancements – You can now insert images and change the report theme.

To showcase some of these enhancements, I created a personal BI model based on a customer dataset imported from the AdventureWorksDW2012 database (I attached the Excel workbook). To create a Power View report, click on Insert ð Power View button in the Excel ribbon. This creates an empty Power View report connected to the BI model.

My dataset includes the customer location defined as address, postal code, city, state, and country. I’ve found two ways to visualize geospatial data:

  1. Use longitude and latitude coordinates – Power View doesn’t support SQL Server geography data types. However, if you have a geography data type, extracting the longitude and latitude values is easy. You just need to query the Lat and Long property of the geography data type.

    SELECT SpatialLocation.Lat, SpatialLocation.Long FROM Person.Address 

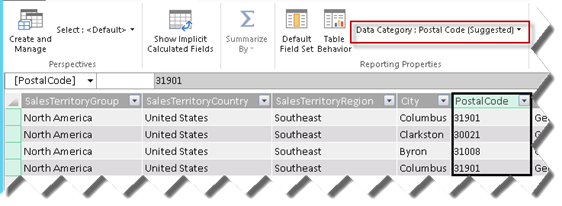
  2. Geocode from an address. If you drop an address field to the Locations zone, the map will prompt you to geocode it. Power Pivot also supports advanced properties and it tries to infer automatically known field categories. For example, in the screenshot below, Power View has identified that the PostalCode field contains zip codes and mapped it to the Postal Code category.

072612_0026_WhatsNewinO1

If you place multiple fields in the Locations zone, Power View will allow you to drill down these fields. In my case, I put the StateProvinceName and PostalCode fields in the Locations zone. Consequently, if I double-click on a bubble, Power View will zoom in the map to show me where my customers are located by postal code within that state. I can click the “drill up” in the map right upper corner to go back to the state level.

Note Not sure if this is a bug with the pre-release version of Office 2013, but Power View seems to have a problem with drilling down to entities with the same name. For example, initially I put the City field in the Locations zone but when I drilled down Georgia, Power View switched to Columbus, Ohio because both Ohio and Georgia have a city Columbus. It appears that Power View drills down to the first entity in finds in that level instead of constraining the list to the parent’s children only.

072612_0026_WhatsNewinO2

The Power View report also shows a pie chart. If I click a segment on the pie chart it cross-filters the map. For example, if I click the 2005 pie, the map highlights customers with sales in 2005. Vice versa, if I click a bubble in the map, the pie chart gets updated to show the data for that bubble only, such as sales for customers in Georgia. The field list shows that Power View now supports KPIs and hierarchies. The Gross Sales is defined as a KPI in the underlying model and Customers by Country is defined as a hierarchy. Finally, you can change the report theme and add images from the Excel’s Power View ribbon.

072612_0026_WhatsNewinO3

Localizing Reports in SharePoint

In a current project, international users indicated that they prefer dates and numbers to be formatted using their regional settings. Localization is a big and complicated topic and we’ve been fortunate that the scope was limited to just number and date formatting … or, at least so far.

Localizing reports on a report server running in native mode is easy. You just need to use culture –neutral format strings, e.g. C for currency of P for percentage, and set the report-level Language property to =User!Language. However, this is not enough for reports running in a SharePoint integrated mode. SharePoint requires installing language packs as follows:

  1. For each language you plan to support, download the corresponding language pack. For example, to download the German language page, change the drop-down to German and download the pack.
  2. Log in a SharePoint Farm Administrator and install the language pack. At the end of the setup process, leave the checkbox to start the wizard in order to run the wizard to reconfigure the farm.
  3. Once the wizard is done, go to the site that you want to localize, click Site Actions -> Site Settings, and then click the Language Settings link under Site Administration.
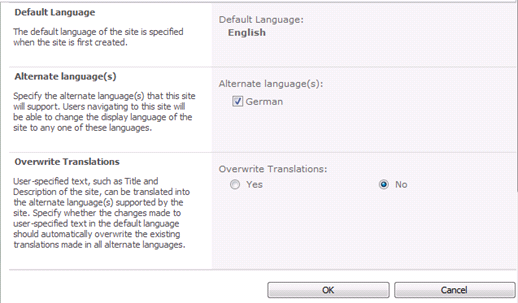
  4. Check all languages that will be supported on the site.

    072312_2000_LocalizingR1

  5. To avoid “The LocaleIdentifier property is not overwritable and cannot be assigned a new value” error (more than likely a bug) when an international user requests a report connected to an Analysis Services cube, change the connection string of the SSAS data sources to pin it to the locale identifier of the server by appending the following setting, as Kasper De Jonge mentions in his blog:
    Locale Identifier=1033
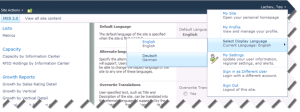
  6. Instruct your users to personalize the display language by expanding the name drop-down and selecting a display language:

    072312_2000_LocalizingR2

Once this is done, the users will see the SharePoint menus translated, and dates and numbers on the reports formatted using the selected display language.

Report Timeout Quest Reloaded

A long time ago, I wrote a blog about possible reasons for Reporting Services reports to time out. This issue raised its head again; this time in SharePoint 2010 environment where long running reports would time out after about 2 minutes. To resolve:

  1. On each Web Front End (WFE) server, edit the web.config file of the SharePoint web application. For the default web application, the web.config file is located in C:\inetpub\wwwroot\wss\VirtualDirectories\80.
  2. Find the httpRuntime element and change the executionTimeout setting. The default value is 110 seconds.

<httpRuntime maxRequestLength=”51200″ executionTimeout=”1000“/>

  1. Save the web.config file. No need for iisreset since the ASP.NET process will apply the settings on change.

As a side note, you shouldn’t have such report hogs but sometimes you can’t avoid them. In this case, the end users requested a report that includes pretty much all measures in the cube sliced by the dimension with the highest cardinality so they can export it to Excel and analyze it in a pivot table.

UPDATE 6/29/2012

There is more to report timeouts if you have a SharePoint custom page that wraps the SQL Server Reporting Services ReportViewer webpart. In this case, the page won’t overwrite the timeout for the AJAX script manager control. To avoid this, make the following changes to the SharePoint master page:

1.    Open the SharePoint Designer and connect to the site.

2.    In the Navigation pane, click the Master Pages section.

3.    Right-click the master page that site uses (v4.master is the default master page), and click Edit File in Advanced Mode.

4.    Locate the ScriptManager element and add an AsyncPostBackTimeout element, as follows:

<asp:ScriptManager id=”ScriptManager” runat=”server” enablepagemethods=”false” enablepartialrendering=”true” enablescriptglobalization=”false” enablescriptlocalization=”true” AsyncPostBackTimeout=”0″/>

5.    Save the master page, check it in, and approve it (if you use the SharePoint publishing features).

Important If the reports are deployed to a SharePoint subsite, use the SharePoint Designer to connect to the subsite and make the changes to the subsite master page.