Posts

SSRS Going on 20

Last year around this time, I went to Antarctica on an expedition ship. Although I got my fair share of icebergs, whales, and penguins, I found it interesting to reproduce some of the experience of the first explorers. On our way back, we got it pretty rough crossing the Drake passage. 80% of the passengers succumbed to sea sickness. There was a huge swell during the night. The next day the captain told us that we faced some 10-meter waves. It felt like a bad roller coaster ride. Yet, the explorers did it. On wooden ships with no stabilizers and communication. Not knowing where they were going and with a high probability that they won’t survive!

What does this have to do BI? The remote connection is that 20 years ago a small group from Microsoft was set up to create a new reporting tool that was code-named “Rosetta” and later became known as SQL Server Reporting Services (SSRS). They took a brave new approach and soon SSRS wiped out the established reporting tools, and together with Analysis Services and SQL Server, became one of the pillars of Microsoft BI. SSRS open new possibilities and certainly changed my career. Kudos to the SSRS team and human spirit!

Atlanta Microsoft BI Group Meeting on January 9th (Getting Started with Power BI Paginated Reports)

Atlanta BI fans, please join us for the next meeting on Monday, January 8th, at 6:30 PM ET. Eric Flamm will review paginated (SSRS) reports in Power BI. Your humble correspondent will help you catch up on Microsoft BI latest. For more details and sign up, visit our group page.

Presentation: Getting Started with Power BI Paginated Reports

Delivery: In-person

Date: January 9

Time: 18:30 – 20:30 ET

Level: Beginner

Food: TBD


Agenda:

18:15-18:30 Registration and networking

18:30-19:00 Organizer and sponsor time (events, Power BI latest, sponsor marketing)

19:00-20:15 Main presentation

20:15-20:30 Q&A


Venue

Improving Office

11675 Rainwater Dr

Suite #100

Alpharetta, GA 30009


Overview: Power BI Paginated Reports are the successor to SQL Server Reporting Services reports (although SSRS is still part of the SQL Server BI Stack). Using the same RDL (report definition language) as SSRS, Power BI Paginated Reports enable report developers to create “pixel-perfect” reports with complete control over item placement, pagination, row and column grouping and subtotals, etc. In this demo-centric session, we’ll use Power BI Report Builder on the desktop to design reports using datasets from local sources as well as Azure databases. We’ll look at parameterization and custom expressions and publish our report to the Power BI service. If time permits, we’ll take a look at building paginated reports in the online service, a capability Microsoft released last year.


Speaker: Eric is an independent Business Intelligence consultant, serving a range of clients including service and manufacturing enterprises, startups, and non-profit organizations. His practice includes SQL Server-based projects as well as Excel, Office Automation, and the occasional Microsoft Access project. Eric works with the Atlanta PASS Chapter as the webmaster and has volunteered with SQL Saturday Atlanta since the first event (SQL Saturday #13). Recently, he has presented to SQL Saturday Atlanta, SQL Saturday Chicago, Atlanta Code Camp, the Atlanta Power BI chapter, and the Kennesaw (GA) Amazon Web Services Meetup group.

PowerBILogo

Atlanta MS BI and Power BI Group Meeting on January 3rd

Please join us online for the next Atlanta MS BI and Power BI Group meeting on Monday, January 3rd, at 6:30 PM ET.  Paul Turley will show us how to integrate Power BI with paginated (SSRS) reports. And your humble correspondent will update you on the Power BI latest.  For more details and sign up, visit our group page.

Presentation:Power BI Paginated Reports: The New Old Operational Reporting Platform
Date:January 3rd
Time:6:30 – 8:30 PM ET
Place:Click here to join the meeting
Overview:Power BI Paginated Reports (aka SQL Server Reporting Services) was old but now it’s new again. Available on-premises or in the Power BI service with flexible licensing, you have multiple options to implement operational reports. This session will briefly cover the differences between analytic and operational reports; and help you understand the advantages and trade-offs using Power BI Paginated Reports, Power BI Report Server and SQL Server Reporting Services. Material from our forthcoming book: Paginated Report Recipes.
Speaker:Paul is a Principal Consultant for 3Cloud Solutions (formerly Pragmatic Works), a Mentor and Microsoft Data Platform MVP. He consults, writes, speaks, teaches & blogs about business intelligence and reporting solutions. He works with companies around the world to model data, visualize and deliver critical information to make informed business decisions; using the Microsoft data platform and business analytics tools. He is a Director of the Oregon Data Community PASS chapter & user group, the author and lead author of Professional SQL Server 2016 Reporting Services and 14 other titles from Wrox & Microsoft Press.  Paul is a 2021 FastTrack Recognized Solution Architect and holds several certifications including MCSE for the Data Platform and BI.
Prototypes without PizzaPower BI Latest

PowerBILogo

Drillthrough Paginated Reports

I’m helping a client convert a few SSRS reports from SharePoint to Power BI Premium Per User (PPU). SSRS is of course near and dear to my heart because of all the work I’ve done around it circa 2004-2010 (yep, it’s been that long), books, MVP awards, etc. Since its humble beginnings, SSRS have had a solid architecture that excelled in extensibility. You’d be hardly pressed to face a requirement that couldn’t meet with SSRS back then.

Unfortunately, most of these extensibility features, such as custom assemblies, custom security, custom delivery extensions, custom renderers (essentially everything related to custom code) didn’t make it to paginated reports in Power BI Premium. Not many companies are using these features, so they probably won’t be a showstopper for your migration. To their credit, Microsoft is closing the gap between SSRS and paginated reports. As of now, the feature limits that you might run into are:

Missing FeatureWorkaround
Shared data sources/datasetsReport-specific (embedded) data sources/datasets (yep, a maintenance nightmare)
Drillthrough report actionsChange to URL action and provide URL to drillthrough reports passing filters on the URL
Document mapNo workaround

Instead of drillthrough report actions, implement URL-based actions. Assuming embedding for your organization, here are the high-level steps:

  1. Deploy the drillthrough report to Power BI. Again, you must deploy to a Premium or PPU workspace. Run the report. It should run successfully. Go to File, Embed menu and copy the iframe code (assuming you want to embed the report in your company’s portal). The iframe code should look like this:
    <iframe width="800" height="600" src="https://app.powerbi.com/rdlEmbed?reportId=b82ed928-d9d9-42b5-b6cc-a6e8f3e9dc4d&autoAuth=true&ctid=<your tenant id>" frameborder="0" allowFullScreen="true"></iframe>
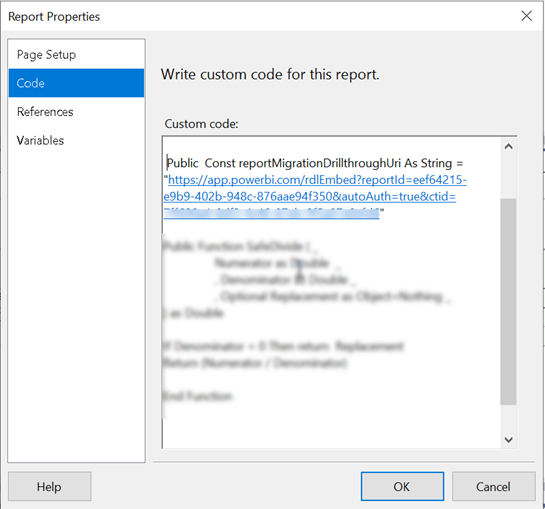
  2. Open the main report in Visual Studio or Power BI Report Builder. In the report properties, Code tab, define a public constant to the drillthrough report(s). Or, you can define internal parameters.

  3. Now find all instances of drillthrough actions in the main report. If there are many, it might be easier to open the report RDL in Visual studio and search for <Drillthrough>. For each textbox with drillthrough replace the Drillthrough section in the <ActionInfo> element with a Hyperlink, such as
<ActionInfo>
 <Actions>
 <Action>
 <Hyperlink>=String.Format("{0}&amp;rp:ProfileID={1}&amp;rp:Month1={2}&amp;rp:Month2={3}", Code.reportMigrationDrillthroughUri, Parameters!ProfileID.Value, Parameters!Month1.Value, Parameters!Month2.Value)</Hyperlink>
 </Action>
 </Actions>
</ActionInfo>
  1. In the example above, the positional string replace will replace the {0} placeholder with the report drillthrough constant you defined before. Then, you provide values for the drillthrough report parameters (in this case, the drillthrough report takes three parameters).
  2. Test the main report and drillthrough links. If all is well, publish the main report to Power BI. Obtain its embedded iframe code and add it to your app page.

Use the secure embed iframe URL for the main report so that it’s embedded in the app instead of opening in a new browser tab. Unfortunately, the drillthrough reports will open in a separate tab and I couldn’t find a workaround to render them inside the iframe of the main report.