Tips for Extended Events
Load testing and troubleshooting Analysis Services often requires capturing a query trace. The lightweight option to do so is to create an Extended Events (xEvents) session. Let’s say you want to capture all query traffic for 24 hours. You might opt to use the SQL Server Profiler, but it’s implemented as a desktop app (there must be an active Windows session but what happens if the Profiler crashes or corporate policy logs you out?) and it may impact the performance of your production server. The recommend way is to set up an xEvents session that logs the required events (same events you see in SQL Server Profiler) to a *.xel file.
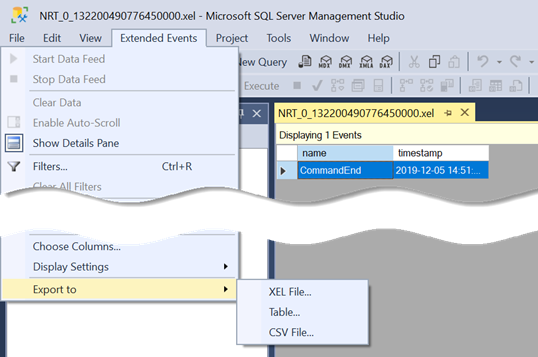
What’s not so obvious is how to analyze the file. The easiest way is to open the .xel file in SQL Server Management Studio (SSMS). You’ll see a new Extended Events menu added to the menu bar. Among other things, this menu allows you to export the trace to a SQL Server table!
What makes an xEvents session even more useful is that it allows you to correlate events. For example, for some obscure reason the Analysis Services PropertiesList info is only available in the QueryBegin event. However, capturing the QueryEnd event is good enough because it gives you all the info you need, such as the query duration, query statement, database name, etc. But what if queries come from a Power BI report via a gateway to an on-prem SSAS instance? In this case, the user identity is in the PropertiesList info because the gateway uses a trusted account to connect to SSAS. So, now you must capture QueryBegin if you want to know who sent the query. Fortunately, you can use the RequestID GUID column in the trace to correlate QueryBegin with QueryEnd to look up the username from the QueryBegin row and to add it to the QueryEnd event.


