Kerberos Woes

[Wikipedia] Cerberus, (pronounced /ˈsɜrb(ə)rəs/);[1] Greek form: Κέρβερος, /ˈkerberos/[2] in Greek and Roman mythology, is a multi-headed hound (usually three-headed) which guards the gates of Hades, to prevent those who have crossed the river Styx from ever escaping.

I think Microsoft got the name right although the Windows version of Kerberos has more than three heads for sure. Yet another weekend spent in troubleshooting Kerberos. This one has an interesting setup.

  1. SharePoint Server 2010 on a Web Front End (WFE) box.
  2. SharePoint Server 2010 (core install) + SQL Server and Reporting Services 2008 integrated with SharePoint on a second box.
  3. Analysis Services 2008 R2 on a third box.

The customer wanted this setup to minimize the SQL Server licenses. Microsoft recommends installing Reporting Services on the WFE servers but this requires as many SQL Server licenses as the number of the WFE servers, plus probably two more (for SQL Server to host the SharePoint configuration databases and Analysis Services (if it is on a separate box). By contrast, the above setup requires two SQL Server licenses irrespective of the number of the WFE servers.

We hit issue #1 when we tried to deploy from BIDS and we got a login prompt that just won’t go away. This was related to the fact that the SQL Server setup configures Reporting Services for NTLM authentication. Since this scenario required Kerberos delegation, we have to change the following setting in the rsreportserver.config file:

<Authentication>

<AuthenticationTypes>

    <RSWindowsNegotiate/>

    <!–RSWindowsNTLM/–>

</AuthenticationTypes>

<EnableAuthPersistence>true</EnableAuthPersistence>

</Authentication>

As you can see, we had to disable NTLM and add Negotiate. This helped us to a point where BIDS can deploy reports to the SharePoint site and we can manage data sources and report properties. However, for some reason, after a few minutes the data source and report definitions somehow would get invalidated and trying to access their properties result in HTTP 401 User unauthorized error. Re-deploying the reports and definitions “fix” the definitions for a few minutes and then 401 error again.

More troubleshooting…and we figured out the issue was related to a misconfigured SPN entry for the SSRS service account on the ServicePoint core (database) server by executing setspn -l <SSRS service account>. The results didn’t include http/<the account used for SQL Server>. Once we got the Active Directory administrator fix this, the issue went away.

We found the Configuring Kerberos Authentication for SSRS 2008 R2 with SharePoint 2010 whitepaper very useful. It’s a must read before venturing into the Kerberos candy land

Good luck!

Applied PowerPivot Course Available

082310_0058_PowerPivotT1I am excited to announce that Prologika has added an Applied PowerPivot course to the list of our training offerings in response to the strong interest for self-service BI. The class can be delivered as two-day online class (4 hours each day) or as one full-day onsite class. The cost for the online version is $599. Applied PowerPivot is designed to help students become proficient with PowerPivot and acquire the necessary skills to implement PowerPivot applications, perform data analysis, and share these applications with other users. The full course syllabus is available here. I scheduled the first run for September 21st. Happy self-service BI!

PowerPivot Implicit Data Conversion

A student noticed an interesting behavior while I was teaching my PowerPivot class last week. He noticed that PowerPivot lets you join a text-based column to a numeric column. As it turns out, PowerPivot does an implicit conversion to text when it discovers that you are attempting to join columns of different data types. However, as a best practice, you should convert numeric columns to a numeric data type, such as Whole Number. This will help PowerPivot minimize storage and improve performance.

Professional Microsoft PowerPivot for Excel and SharePoint

I had the pleasure to read the book Professional Microsoft PowerPivot for Excel and SharePoint by Sivakumar Harinath, Ron Pihlgren, and Denny Guang-Yeu Lee. All of the authors are with the Microsoft Analysis Services team. Together with David Wickert, Denny Lee runs the http://powe073110_0327_Professiona1rpivottwins.com/ blog, which is “dedicated to all things PowerPivot”. Siva has written the 2005 and 2008 editions of the Professional SQL Server Analysis Services with MDX. So, the book is straight from the horse’s mouth.

I really liked the book. It’s easy to follow and includes insightful tips. The book targets business users who are interested in creating self-service BI solutions. IT professionals and BI practitioners who will manage PowerPivot applications will find the book useful as well. Professional Microsoft PowerPivot for Excel and SharePoint incudes tutorials that walks the user through the necessary steps to build a PowerPivot-based solution. These steps include importing the data, enriching the data model, creating calculations, and reports. The code samples use a sample database for the healthcare industry – I guess that’s because healthcare is the only industry with a budget for IT applications nowadays, or at least self-service BI apps. Adventure Works is probably waiting for the economy to bounce back.

The authors are quick (page 17) to explain the role of the Corporate BI now that the self-service BI era has dawned on us – something that I was eager to get the official Microsoft opinion about. Their short answer is “not much will change”, and that’s precisely what I think. IMO, self-service BI is a compromise between corporate BI (best) and reality. Ideally, I don’t want business users to do anything but analyze. Why should business users import, relate data, and create calculations that as complexity increases look more bizarre then the equivalent MDX expressions? But we don’t live in a perfect world and PowerPivot comes to fill in the void. Here are some scenarios where PowerPivot might be a good fit:

1. You don’t have a data mart and Excel spreadsheets rule the reporting world. With some help from IT, business users might be able to get the data in the right format and report from it right in Excel.

2. You do have a data mart but you don’t want/don’t have the skills to build a cube. But if you’ve gone that far, why not travel the remaining 20% and have a cool cube that business users trust and love?

3. You have a data mart/cube but not all data is in the data mart/cube or you need to mash up data from various data sources.

4. You suffer from the NIHS (Not Invented Here Syndrome) and you just want to do things your way despite what IT and BI guys like your humble correspondent tell you.

All of these scenarios require compromises in terms of data quality, security, features, and implementation effort. The problems that we aim to solve with corporate BI are not trivial and there are no shortcuts. I know it and you know it. So, be skeptical when you see an impressive presentation that shows how a self-service BI will take upon the corporate BI, no matter if the tool is PowerPivot, QlickView, Tableau, or something else.

Overall, I’d highly recommend this book to anyone interested in PowerPivot and self-service BI. The book does a great job explaining the capabilities and limitations of the tool. I couldn’t stop reading it!

PivotViewer Extension for Reporting Services – a Cool BI Fusion with Confusing Name

Although late to the party, I announce the arrival of a very interesting BI technology – PivotViewer Extension for Reporting Services – CTP1. What’s interesting is that it leverages several BI technologies to provide great data visualization:

  1. The Microsoft LiveLabs Pivot which was developed by Microsoft Research.
  2. PowerPivot – a Microsoft self-service BI tool.
  3. Analysis Services R2
  4. Reporting Services R2
  5. SharePoint 2010

You should keep a close eye of this combination (or at least the last four) as it will become increasingly important in the Microsoft BI stack. Robert Bruckner has provided details about the new arrival. Christian Petculescu, a Principal Architect on the SSAS team, is the driving force behind it. Other MVPs have spread the news. But Kasper de Jonge made my day! He has written a GREAT blog about it with step by step instructions to create your own PivotViewer solution. His blog also cleared my confusion about the role of Reporting Services in this architecture. So, Reporting Services has not been extended in any way. It’s just been used an image generator to produce the Pivot images. A better name for the tool could have been a PivotViewer Add-in for SharePoint.

Interestingly, Microsoft Pivot does it work by counting items in collections. It doesn’t support any other aggregation functions. Therefore, PivotViewer is not a replacement for Excel PivotTable. It gives you an additional way to visualize you data.

UPDATE

Amir Netz, the mastermind behind PowerPivot, demonstrated PivotViewer during the second day keynote of the BI conference this year. Forward to 1:21. He also talks about the new features that the next version or PowerPivot (SQL Server 11) will bring in, including KPI support, BIDS development support, etc.

Atlanta BI Group First Meeting Topic Announced

I’ve just updated the Atlanta BI Group home page to announce the topic for our first meeting on August 23th. Given the great interest surrounding Self-service BI, I’ll present “Self-service BI with Microsoft PowerPivot”.

Hope you can make our first meeting!

OLAP PivotTable Extensions for Excel 2010

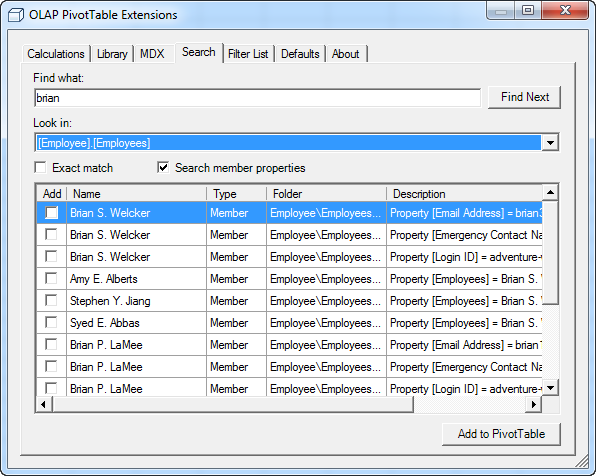
Kudos to Greg Galloway (SQL Server MVP) for upgrading his fantastic OLAP PivotTable Extensions for Excel 2010 add-in (now available in both x32 and x64). This add-in is one of the first third party tools I install on a new machine. Since the Excel team seems to be ignoring customer feedback for improving the Excel BI features, OLAP PivotTable provides what’s lacking, including:

  • Excellent search capabilities with Field List, Dimension Data and attribute options. By contrast, the Excel 2010 search is limited to searching within a hierarchy level only. This is pretty much useless with parent-child hierarchies. If I know what level the member is located, I don’t have to search, right?
  • Getting the MDX query – Excel refuses to expose the actual MDX.
  • Calculated members – Another feature that business users keep asking about but Excel doesn’t budge. The Calculations tab of the add-in lets you create calculated members. It will be great if this is more user-friendly. Ideally, the user should get the same Calculation Member dialog that’s included in Reporting Services.
  • Filtering of attribute members

071010_2228_OLAPPivotTa1

Yet Another Report Timeout Solved

Every now and then, I run into mysterious report timeouts. This time the client had a farm of two report servers integrated with MOSS with long running reports that would time out after two minutes or so. Normally, you shouldn’t have such report monsters but life is not perfect, right? The client did a due diligence and had checked/changed every possible timeout setting, including:

  1. Report Processing Timeout in the Reporting Services Server Defaults settings in SharePoint Central Administration.
  2. The httpRuntime settings on all SharePoint farm servers’ web.config files:

    <httpRuntime maxRequestLength=”51200″ executionTimeout=”9000″ />

  3. The “databaseQueryTimeout” value in the RSReportServer.config file from 120 to 900 (15 minutes).

    <Add Key=”DatabaseQueryTimeout” Value=”900″/>

  4. The connection timeout in IIS for the web site on each MOSS server from 120 to 240 seconds.

Alas, no help. Reports would still time out. After much investigation, we discovered a server timeout setting on the load balancer which was set for 2 minutes. After increased it to 15 minutes, the problem went away. So many timeout settings, so little time…

Want more timeout tips? Check out this blog which I wrote four years ago.

Atlanta.MBI Website

The website for the Atlanta Microsoft Business Intelligence SIG is up and running although it’s still work in progress.

http://atlantabi.sqlpass.org

1. Please register.

2. Please fill in the two polls on the first page for the first meeting attendance and topic of interest.

3. You can post suggestions for our first meeting on the Discussions page (Meetings forum) as a reply to my first post there.

4. Please use the General forum in the Discussions for any general questions.

5. Please spread the news and redirect Atlanta BI fans to http://atlantabi.sqlpass.org.

Venue for Atlanta.MBI Found

The great search for a meeting place for the Atlanta BI SIG is over! I am happy to report that I found the perfect place. Matrix Resources graciously offered to host and sponsor our meetings in a training room at their premises at 115 Perimeter Center Place #250, Atlanta, GA, 30346. I visited their location and another location today and I think their place is great. The room is capable of accommodating 50 people and has a projector. The location is nice too since I was looking for place around this area to accommodate the traffic concerns of as many people as possible. I personally live in Norcross and it would have been nice to take advantage of the Data Profit’s meetup offer but it would have been too selfish J

I also booked the meeting days for the rest of the year. I suggest we meet up every last Monday of the month from 6:30 – 8:30 PM as follows:

8.23, 9.27, 10.25, 11.22 and 12.27

Our first meeting will on be August 23th at 6:30 PM.

My focus now is to put together the Atlanta BI website that will be hosted on sqlpass.org. I’ll let you know when it’s ready so you could register and stay on top of the latest announcements. Stay tuned!