Power View Can’t Load Power Pivot Models

Scenario: You have created an SSRS application in SharePoint and specified that the application pool would use a specific domain service account that is designated to SSRS. When you attempt to create a Power View report from a deployed Power Pivot model, you get the following error:

An error occurred while loading the model for the item or data source ‘<path to Excel file>’. Verify that the connection information is correct and that you have permissions to access the data source.

Here is the full stack:

<detail><ErrorCode xmlns=”http://www.microsoft.com/sql/reportingservices“>rsCannotRetrieveModel</ErrorCode><HttpStatus xmlns=”http://www.microsoft.com/sql/reportingservices“>400</HttpStatus><Message xmlns=”http://www.microsoft.com/sql/reportingservices“>An error occurred while loading the model for the item or data source ‘<path>’. Verify that the connection information is correct and that you have permissions to access the data source.</Message><HelpLink xmlns=”http://www.microsoft.com/sql/reportingservices“>http://go.microsoft.com/fwlink/?LinkId=20476&amp;EvtSrc=Microsoft.ReportingServices.Diagnostics.Utilities.ErrorStrings&amp;EvtID=rsCannotRetrieveModel&amp;ProdName=Microsoft%20SQL%20Server%20Reporting%20Services&amp;ProdVer=11.0.5058.0</HelpLink><ProductName xmlns=”http://www.microsoft.com/sql/reportingservices“>Microsoft SQL Server Reporting Services</ProductName><ProductVersion xmlns=”http://www.microsoft.com/sql/reportingservices“>11.0.5058.0</ProductVersion><ProductLocaleId xmlns=”http://www.microsoft.com/sql/reportingservices“>127</ProductLocaleId><OperatingSystem xmlns=”http://www.microsoft.com/sql/reportingservices“>OsIndependent</OperatingSystem><CountryLocaleId xmlns=”http://www.microsoft.com/sql/reportingservices“>1033</CountryLocaleId><MoreInformation xmlns=”http://www.microsoft.com/sql/reportingservices“><Source>ReportingServicesLibrary</Source><Message msrs:ErrorCode=”rsCannotRetrieveModel” msrs:HelpLink=”http://go.microsoft.com/fwlink/?LinkId=20476&amp;EvtSrc=Microsoft.ReportingServices.Diagnostics.Utilities.ErrorStrings&amp;EvtID=rsCannotRetrieveModel&amp;ProdName=Microsoft%20SQL%20Server%20Reporting%20Services&amp;ProdVer=11.0.5058.0” xmlns:msrs=”http://www.microsoft.com/sql/reportingservices“>An error occurred while loading the model for the item or data source ‘<path>’. Verify that the connection information is correct and that you have permissions to access the data source.</Message><MoreInformation><Source>Microsoft.ReportingServices.ProcessingCore</Source><Message msrs:ErrorCode=”rsErrorOpeningConnection” msrs:HelpLink=”http://go.microsoft.com/fwlink/?LinkId=20476&amp;EvtSrc=Microsoft.ReportingServices.Diagnostics.Utilities.ErrorStrings&amp;EvtID=rsErrorOpeningConnection&amp;ProdName=Microsoft%20SQL%20Server%20Reporting%20Services&amp;ProdVer=11.0.5058.0” xmlns:msrs=”http://www.microsoft.com/sql/reportingservices“>Cannot create a connection to data source ‘TemporaryDataSource’.</Message><MoreInformation><Source>Microsoft SQL Server 2012 Analysis Services</Source><Message>SetAuthContext need to be run as sysadmin.</Message></MoreInformation></MoreInformation></MoreInformation><Warnings xmlns=”http://www.microsoft.com/sql/reportingservices” /></detail>

Resolution: The most important information is the message “SetAuthContext need to be run as sysadmin“. This tells us that the SSRS account doesn’t have admin access to the SSAS instance configured in SharePoint mode. Another way to confirm this is to run the SQL Profiler connected to the SSAS instance, e.g. SERVER\POWERPIVOT, and attempt to create a Power View report. You would see the same error message in the Profiler.

How do we fix this horrible issue? Connect to the SSAS instance in SSMS, right-click on the server node and then click Security. Then, add the SSRS account to the list to grant it admin rights to SSAS. This is something SharePoint should have done during the setup of the SSRS application since the SharePoint farm account has admin rights to the SSAS instance but apparently this step has been omitted.

Where is Power Pivot for SharePoint?

In the process of configuring Power Pivot for SharePoint, you need to run the Power Pivot Configuration Tool, which the documentation explains well here and here. What it doesn’t tell you is that unless you overwrite the URL in the Activate PowerPivot Feature in a Site Collection step, Power Pivot will be activated for the first site collection. I ran into a situation where the customer had installed My Sites and Portal site collections and the tool happily defaulted to activating Power Pivot for the My Sites site collection although we expected it to show up in the portal site.

Ideally, the tool should support checking multiple site collections but it doesn’t – you can specify only one. And if you don’t overwrite the URL, it will pick the first site collection it finds. If your SharePoint farm has other collections, you need to manually activate Power Pivot after the Power Pivot Configuration Tool is done. You can activate Power Pivot for additional site collections as follows:

  1. On a SharePoint site, click Site Actions. Click Site Settings.
  2. In Site Collection Administration, click Site Collection features.
  3. Scroll down the page until you find PowerPivot Integration Site Collection Feature, and then click Activate.

Atlanta MS BI Group Meeting on Jun 30th

Join us for our next Atlanta MS BI Group meeting tomorrow, Monday, June 30th, to learn about implementing BI for financial reporting. You’ll also get a glimpse of the newly announced Microsoft Azure Machine Learning. Spread the word and invite your coworkers but RSVP on our website so we can plan food accordingly.

Main Presentation:Microsoft BI for Financial Reporting
 Level: Intermediate
Date:Monday, June 30th, 2014
Time6:30 – 8:30 PM ET
Place:South Terraces Building (Auditorium Room)

115 Perimeter Center Place

Atlanta, GA 30346

Overview:Using a Finance data mart in SQL Server 2012, I will demo how to use SSAS 2012 and Excel 2013 for Financial Reporting. This will include the basic DW model for Financial Reporting, how to configure the key dimensions in SSAS, how to setup writeback functionality in the Finance Cube with Security, and how to use Excel for the Reporting and writeback execution to update Budgets within the Cube.
Speaker:Justin Stephens began working with SQL Server 2000 (DW, DTS, and SSAS) in the fall of 2000 for a small software company in Texas. Early on, he became the SME for MDX Reporting using ASP and later ASP.NET. He was given a few projects using DTS/SSIS that expanded the reporting capabilities. In 2005, Justin spread my wings and began a long exodus from Texas that led him to Atlanta. Over the last 13 years, he has worked for/with some notable companies (Wal-Mart, McKesson, Dell, AMD, BCD Travel, Barclay’s) in various industries (Retail, Wholesale Distribution, Finance, Travel, and Education). During this time, he achieved MCITP in Business Intelligence using the 2008 R2 BI Stack. Justin is a die-hard proponent of the MSBI stack.
Sponsor:At TEKsystems, we understand people. Every year we deploy over 80,000 IT professionals at 6,000 client sites across North America, Europe and Asia. Our deep insights into IT human capital management enable us to help our clients achieve their business goals – while optimizing their IT workforce strategies. We provide IT staffing solutions, IT talent management expertise and IT services to help our clients plan, build and run their critical business initiatives.
Prototypes with PizzaMicrosoft Azure Machine Learning by Teo Lachev
With machine learning, computers can approach human performance in perception and understanding across vast amounts of data. Expensive and disconnected tools stood in the way of this innovation, but today Microsoft is democratizing machine learning. Get a glimpse of the Microsoft new cloud-based predictive analytics offering.

Microsoft Azure Machine Learning

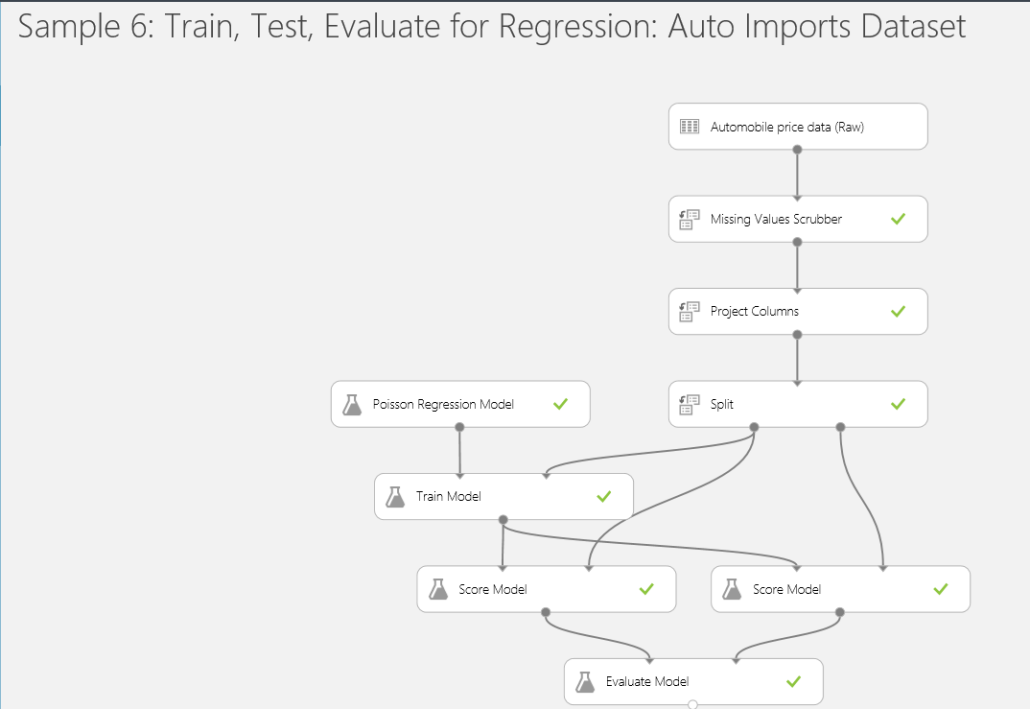
Yesterday, Microsoft announced Microsoft Azure Machine Learning, previously known as project Passau. Your humble correspondent has been participating in the Preview Program. Basically, Microsoft Azure Machine Learning is a service for self-service cloud-based predictive analytics. You upload your data to the cloud, define datasets and workflows to create “experiments”. Previously, you could create data mining models using the SQL Server data mining capabilities. Microsoft Azure Machine Learning to organizational DM models is what Power Pivot to Analysis Services is. Besides its cloud-based nature, Microsoft Azure Machine Learning offers:

  1. Data sources – Allow business users to upload source data as files.
  2. Workflows – Business users can drag and drop tasks to create workflows, such as to perform basic data transformation tasks, remove outliers, train, and score mining models. Users will familiar with SSIS will undoubtedly find workflows similar. Users familiar with SAS data mining will do the same.
  3. Scalability – You can use Big Data coming from Azure HDInsight and scale out accordingly.
  4. Endpoints – You can easily publish the predictive results as an ODATA service.
  5. Algorithms – There are more algorithms than the nine algorithms in SQL Server

061814_0133_MicrosoftAz1

Optimizing Arbitrary Shaped Sets

I’m working on optimizing a fairly large cube (2.5 TB) with some 25 billion rows in the fact table. The customer was complaining about long-running queries. Most queries would specify a time range that was passed to the query filter. For example, if the user wants to see the aggregated data from May 25th 20:00 to June 2nd 19:00, the query WHERE clause would like this:

WHERE

(

{

[Date].[Date].[Date].&[20140527] * [Hour].[Hour].&[20] : [Hour].[Hour].&[23],

[Date].[Date].[Date].&[20140528]:[Date].[Date].[Date].&[20140601] * [Hour].[Hour].&[0] : [Hour].[Hour].&[23],

[Date].[Date].[Date].&[20140602] * [Hour].[Hour].&[0] : [Hour].[Hour].&[19]

}

… additional dimension filters here

)

This an example of using arbitrary-shaped sets which Mosha wrote about here and Thomas Kejser here.

“The resulting union set has interesting shape – it cannot be represented as pure crossjoin of attribute hierarchies. Such sets are nicknamed “arbitrary shaped sets” in Analysis Services, because they represent shapes of arbitrary complexity. Analysis Services in general doesn’t like arbitrary shaped sets, and there are often performance issues when using them, but if the business requirement calls for them – they can be used and will work correctly, although not most efficiently.”

Indeed, the server doesn’t like them and it would happily scan all partitions. In this case, the cube is partitioned by hour and data is kept for 40 days so there are 960 partitions. Although the above query spans 120 hours (partitions), the profiler would show that the server scans all 960 partitions, resulting in enormous amount of data being read. As it turns out, the WHERE clause is not optimized to project the filter on partitions. However, SUBSELECT filters are optimized because most reporting tools, such as Excel and SSRS, use them. The solution was simple: replace the WHERE clause with SUBSELECT to bring the query execution time from minutes to seconds:

FROM

(

SELECT

{

[Date].[Date].[Date].&[20140527] * [Hour].[Hour].&[20] : [Hour].[Hour].&[23],

[Date].[Date].[Date].&[20140528]:[Date].[Date].[Date].&[20140601] * [Hour].[Hour].&[0] : [Hour].[Hour].&[23],

[Date].[Date].[Date].&[20140602] * [Hour].[Hour].&[0] : [Hour].[Hour].&[19]

}

ON 0 FROM [<Cube>]

)

WHERE (… additional dimension filters here)

Partition Bug with Visual Studio

There is a glaring bug with Multidimensional and Visual Studio 2012 and above. When attempting to add a new partition, the Partition Wizard finishes without error but no partition is added. Interestingly, no one has reported this bug more than two years after these Visual Studio editions have shipped. A couple of workarounds exist:

  1. Use SSDT or Visual Studio 2010 to create partitions. You can open your SSAS 2012 project in any Visual Studio edition starting with 2010.
  2. Add the partition either programmatically using AMO or by making changes directly to the *.partitions file.

On the subject of partitions, note that MS has marked the following features deprecated:

  • Remote partitions
  • Remote linked measure groups
  • Linked Dimensions
  • Dimension writeback

These features won’t be terribly missed. I haven’t seen remote partitions being used in real life except in BI certification exams. Linked measure groups also needs linked dimensions, but again, nobody in practice appears to use cross-server linked measure groups. These are cool features “on paper” which could and perhaps should have been popular, but they’ve never caught on enough for various reasons. If you do use them, now it’s time to provide feedback to MS. If you give them a good reason why you need a feature, they will probably reconsider.

Presenting at SharePoint Saturday Atlanta 2014

I’ll be presenting “10 Ways to Maximize Your SharePoint BI Investment” at SharePoint Saturday Atlanta 2014 on June 21st.

“Join me to learn how to take the most out of your on-prem or cloud SharePoint investment to promote organizational and self-service BI. We’ll compare features of SharePoint editions and discuss options to visualize data from corporate databases and analytical models. Business users will learn how to share their self-service BI visualizations with teammates. We’ll discuss how Office 365 and Power BI can help you implement a cloud-based environment for ease of sharing, collaboration, and information access.”

I hope you can make it. You can register here.

Atlanta MS BI Group Meeting on May 19th

Join us for our next Atlanta MS BI Group meeting tomorrow, Monday, May 19th, to learn about Power Query. Spread the word and invite your coworkers but RSVP on our website so we can plan food accordingly.

Main Presentation:Power Query
 Level: Intermediate
Date:Monday, May 19th, 2014
Time6:30 – 8:30 PM ET
Place:South Terraces Building (Auditorium Room)

115 Perimeter Center Place

Atlanta, GA 30346

Overview:So much data is stored on the web, yet merging it with our enterprise data can be a challenge. In this session we’ll use Power Query to quickly harvest historical data about SQL Saturday from its site, combining event, session and speaker details with other publicly available data sets. We’ll create custom functions with Power Query’s M language to collect and transform the data from multiple web pages. We’ll then move the data into Power Pivot and explore our results with Power View and Power Map. We’ll even cleanse the data without leaving Excel, leveraging DQS (Data Quality Services) through the MDS (Master Data Services) Excel add-in.
Speaker:Julie Smith is a Microsoft SQL Server MVP and a BI consultant for Innovative Architects in Atlanta, GA. She’s implemented increasingly complex ETL solutions for over a decade at various organizations. She’s also worn many other database “hats” in her career – production DBA and database developer–but ETL is her true passion. Julie is an MCTS in SQL Server 2008 BI and holds a BA from the University of South Carolina. She and Audrey Hammonds co-created The Datachix.com blog.

Rob Volk is a SQL Server DBA in the Metro Atlanta area since 2001. An MCITP, he also moderates and answers the forums on SQLTeam.com. While an old-time cranky DBA, he no longer considers “business intelligence” an oxymoron and is delightedly dipping his toes into the BI ocean, and loves to do things in new and unusual ways.

Sponsor:Since 2005, Innovative Architects has been serving industries to help solve business and technology challenges. Led by our great associates, we specialize in a wide array of cutting edge Microsoft technologies that we leverage to help our customers achieve the highest level of success with their technology solutions. We provide business consulting, development and implementation services for Microsoft platforms which include BizTalk, SharePoint, .NET, Business Intelligence and much more.
Prototypes with PizzaPower BI Forecasting by Teo Lachev

Calculating Inception-to-Date Measures

A requirement popped up for calculating an inception-to-date (ITD) measure.

MDX CALCULATED MEMBER

Aggregate(PeriodsToDate ([Date].[Calendar Hierarchy].[(All)]), [Measures].[Sales Amount])

In MDX, ITD is not much different than other time calculations, such as YTD or QTD. We only need to specify that the calculation will be performed over the top-most level of the Date hierarchy whose default name is ([Date].[Calendar Hierarchy].[(All)]. Of course, time calculations should be added to a shell dimension and a scope assignment can be used then in the cube script:

Scope (

[Accounting Date].[Calendar Year].[Calendar Year].Members,

[Accounting Date].[Date].Members ,

[Relative Date].[ITD]

);


this =

Aggregate

(

{[Relative Date].[PTD]} * PeriodsToDate ([Date].[Calendar Hierarchy].[(All)])

);

End
Scope;

DAX MEASURE

=CALCULATE(SUM(‘Reseller Sales'[Sales Amount]), FILTER(ALL(‘Date’), ‘Date'[Date] < MAX(‘Date'[Date])))

In DAX, we pass a table consisting of the dates we need to aggregate over as a second argument of the CALCULATE function. We need to use the ALL function to ignore the row context of the Date table in order to calculate the date range by filtering the date table until the current period. The MAX function is used to get the last date of the current period on the report, e.g. 10/31/2012 if the month is October 2012.

3 Techniques to Save BI Implementation Effort

Everyone wants to press a button and have the entire BI system generated and ready to go. But things are not that simple. You know it and I know it. Nevertheless, BI automation tools are emerging with growing promises that propelled them to the Top 10 BI Trends according to the Information Management magazine. As a side note, it was interesting that the same article put Big Data in the No 1 spot despite that Gartner deemphasized the Big Data hype (based on my experience and polling attendees to our BI group meetings, many don’t even know what Big Data is). While I don’t dismiss the BI auto-generators can bring some value, such as impact analysis and native support of popular systems, such as ERP systems, there are also well known cautions, include vendor lock-in, a new toolset to learn, suboptimal performance, supporting the lowest feature denominator of targeted database, etc. However, you don’t have to purchase a tool to save redundant implementation effort. Instead consider the following techniques:

  1. Use the ELT (extraction, load, and transform) pattern instead or ETL (extract, transform, and load). While different solutions require different patterns, the ETL pattern is especially useful for data warehouse implementation because of the following advantages:
    1. Performance – Set-based processing for complicated lookups should be more efficient than row-by-row processing. In SQL Server, the cornerstone of the ETL pattern is the T-SQL MERGE statement which resolves inserts, updates, and deletes very efficiently.
    2. Features – Why ignore over two decades of SQL Server evolution? Many things are much easier in T-SQL and some don’t have SSIS counterparts.
    3. Maintenance – It’s much easier to fix a bug in a stored procedure and give the DBA the script than asking to redeploy a package (or even worse a project now that we’ve embraced the project model in SSIS 2012).
    4. Upgrading – As we’ve seen, SQL Server new releases bring new definitions that in many cases require significant testing effort. Not so with stored procedures.
    5. Scalability – if you need to load fact tables, you’d probably need to do partitions switching. This is yet another reason to stage data first before you apply transformations.
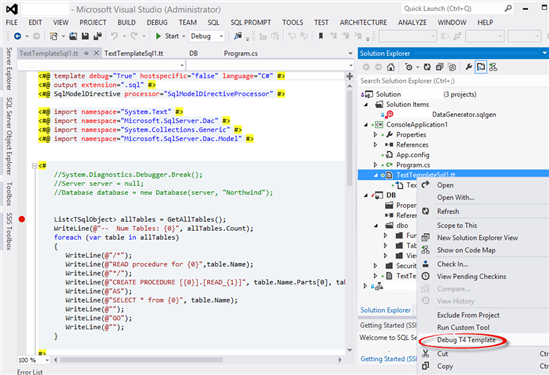
  2. Automate the generation of stored procedure. The ELT pattern relies heavily on stored procedures. If you have to populate a lot of tables, consider investing some upfront development effort to auto-generate stored procedures, such as by using the Visual Studio Text Templates (also known as T4) templates. Note that to be able to debug them in Visual Studio 2012, you would need to add the template to a .NET project, such as a console application.

5415.2014-05-10_19-22-41.png-550x0

3.  Automate the generation of SSIS packages. If you embrace the ELT pattern, your SSIS packages will be simple. That’s because most of the ELT code will be externalized to stored procedures and you would only use SSIS to orchestrate the package execution. Yet, if you have to create a lot of SSIS packages, such as to load an ODS database, consider automating the processing by using the Business Intelligence Markup Language (BIML) Script. BIML is gaining momentum. The popular BIDS Helper tool supports BIML. And, if you want to take BIMS to the next level, my friends from Varigence has a product offering that should help.