SQL Saturday BI in Atlanta is around the corner. Prologika will deliver two sessions at this event on September 22nd:
Bridge Analytics and Developer Worlds with Power BI and PowerApps by your humble correspondent, starting at 9 AM
One of the Power BI most prominent strengths is that it’s a part of the much broader Microsoft Data Platform that spans various on-premises and cloud offerings for data storage, processing, and analysis. Join me to learn how to integrate Power BI with PowerApps and discover exciting new possibilities that redefine the meaning of a report. During this entirely hands-on, no-slides session, I’ll walk you through the steps to implement a popular report requirement for writeback, that Power BI doesn’t natively support.
Data Quality – Plain & Simple by our master data management guru, Neal Waterstreet, starting at 12:30 PM
Data quality is a subject that comes up over and over again in many organizations. Most executives are concerned about the quality of the information used in their decisions. We talk about “good data” and “bad data” but what do those terms mean? In this presentation, we will first define what data quality is and look at how to measure it with data quality dimensions. Then, we’ll explore common causes for data quality issues and how to perform a data quality assessment. Finally, we’ll review the results and discuss some strategies and tools that can help improve the quality of the data in your organization.
Speaking of data quality, you should attend our next group meeting on Sep 25th at the Microsoft Office in Alpharetta where Profisee will present “Mastering data with Microsoft Master Data Services (MDS) for strategic advantage”.
I hope to meet you at one of these two events!
https://prologika.com/wp-content/uploads/2016/01/logo.png00Prologika - Teo Lachevhttps://prologika.com/wp-content/uploads/2016/01/logo.pngPrologika - Teo Lachev2018-09-16 18:07:502021-02-17 01:01:57Prologika at SQL Saturday BI in Atlanta
Data Analysis Expressions (DAX) is the expression language of Power BI, Power Pivot, and Analysis Services Tabular. It’s very powerful but it’s perceived as complex, requiring a steep learning curve. I’m excited to announce a new 2-day “Applied DAX with Power BI” workshop that I designed to help you become proficient with DAX. You’ll learn practical skills that will help you tackle a wide range of reporting requirements. We’ll start with DAX fundamentals, such as calculated columns and measures, and then progress to more advanced concepts, including such as context transitions, variables, filters, time intelligence, advanced relationships, row-level security, query optimization, and much more. Think of this workshop as Advanced Power BI and the next level from my “Applied Power BI” class. The target audience is data analysts and BI developers wanting to hone their DAX skills with Power BI, Power Pivot, or Tabular.
Here is my entire training catalog with a brief description and link to each course page.
This two-day workshop is designed to help you become proficient with Power BI and acquire the necessary skills to work with online and on-premises data, implement data models on a par with professional models created by BI pros, unlock the power of data by creating interactive reports and dashboards, and share insights with other users. No prior data modeling or reporting knowledge is assumed. Students are welcome to bring their own data to the second day of the class.
Data Analysis Expressions (DAX) is the expression language of Power BI, Power Pivot, and Analysis Services Tabular. It’s very powerful but it’s usually perceived as complex requiring a steep learning curve. This two-day class is designed to help you become proficient with implementing business calculations with Data Analysis Services (DAX).
Targeting BI developers, this intensive 5-day onsite class is designed to help you become proficient with Analysis Services and acquire the necessary skills to implement Tabular and Multidimensional semantic models. Use the opportunity to ask questions and study best practices that will help you achieve a single version of the truth by implementing scalable and secure organizational models. Bring your organizational BI to the next level by learning these two powerful BI technologies in one class!
SQL Server is the most deployed and popular database today. Different types of users need to query data stored in SQL Server data structures. This 2-day instructor led course provides you with the necessary skills to query Microsoft SQL Server databases with Transact-SQL. This course starts with the basics of a SELECT statement and its syntax, and progresses to teach you how to join, aggregate, and convert data.
This four-day class is designed to help you become proficient with the Microsoft BI toolset and acquire the necessary skills to implement an organizational BI solution. You’ll learn how to design a star schema, use SQL Server Integration Services to transform data, and implement a Tabular semantic model. Depending on the students’ skillset, it can be customized, such as to reduce coverage of specific technologies, replace them with other topics of interest, such as Multidimensional instead of Tabular, or cover additional topics, such as Power BI or Reporting Services.
Microsoft SQL Server Reporting Services has evolved into a sophisticated reporting platform that lets you present and analyze data consistently, quickly, and reliably. This intensive 3-day class is designed to help you become proficient with Reporting Services and acquire the necessary skills to author, manage, and deliver reports.
This intensive four-day class is designed to help you become proficient with Analysis Services (Multidimensional) and acquire the necessary skills to implement OLAP and data mining solutions. Learn how to build a cube from scratch. Use the opportunity to ask questions and study best practices!
If your organization have Analysis Services Multidimensional cubes or Tabular models and you want to gain valuable insights from them in Excel, then this course is for you. Designed as a step-by-step tour, this course teaches business users how to become data analysts and unlock the hidden power of data. You’ll learn how to apply the Excel desktop BI capabilities to create versatile reports and dashboards for historical and trend analysis.
Power BI is a suite of products for personal business intelligence (BI). It brings the power of Microsoft’s Business Intelligence platform to business users. At the same time, Power BI lets IT monitor and manage published models to track their usage, security, and estimate hardware and software resources. With Power BI, anyone can easily build personal BI models using the most popular tool – Excel and share them on premises or the cloud.
This two-day class is designed to help you learn the visualization tools that are included in the Microsoft Data Analytics Platform. We’ll start by exploring the Excel reporting capabilities that include pivot (PivotTable and PivotChart) and Power View reports. Then, you’ll learn how to explore data interactively with Power BI Desktop. During the second day of the class, we’ll focus on learning how to create paginated reports with Reporting Services. The class can be customized to discuss other tools, such as SSRS mobile reports or Power Map reports.
This two-day class is designed to help you become proficient with Master Data Services (MDS) and Data Quality Services (DQS). IT and business users learn how to design MDS models and extend them with business rules, attribute groups, and hierarchies. IT will learn how to integrate MDS with upstream and downstream systems and how to enforce secured access. Business users will learn how to use Excel to manage data with the tool they love most!
2
https://prologika.com/wp-content/uploads/2016/01/logo.png00Prologika - Teo Lachevhttps://prologika.com/wp-content/uploads/2016/01/logo.pngPrologika - Teo Lachev2018-09-12 08:23:172018-09-12 11:15:20New “Applied DAX with Power BI” Workshop
Scenario: DAX has its own share of idiosyncrasies that can humble both novice and experienced users. Consider a common example where a measure attempts to return sales for the last date in the Date table. What makes this common is that many real-life calculations require measures that evaluate as of the user-specified date (as of date), which is what MAX(‘Date'[Date]) returns.
As innocent and logically correct this measure is, it fails with “A function ‘MAX’ has been used in a True/False expression that is used as a table filter expression. This is not allowed.” It’s also amusing to see even Microsoft struggling to explain the reason of this error which at some point was on the internal top 10 Microsoft list for DAX “ease of use”. This is what the documentation states about this error:
“The filter expression, MAX(‘Date'[CalendarYear]) attempts to return the largest numeric value in the CalendarYear column. However, in context of the measure expression, it cannot be passed as a table filter expression to the CALCULATE function, causing an error.”
This of course is incorrect. First, the MAX function doesn’t return a table but a scalar value. Second, the CALCULATE function is perfectly capable of taking Boolean expressions. The actual issue is that the Boolean expression is surrounded by a hidden CALCULATE and it’s ambiguous in what context the maximum date should be evaluated. To be consistent with the way filters propagate, it should be in the filter context outside of CALCULATE, but in the row context of the as-of date, which becomes a filter context with MAX expression. But this is not what you would expect, so DAX fails safe with the error.
The workaround suggested by the documentation is to filter the Date table and pass it as a table filter to calculate. This requires ignoring first the filter context on the Date table, only to overwrite it later with the ‘as of date’.
Because the EOP variable is evaluated where it’s defined there is no hidden context and the measure works. Unfortunately, as it stands today, DAX doesn’t allow us to create a global session variable for such scenarios. So, you’d need to include this variable in every measure that requires it.
Speaking of issues with the DAX documentation and variables, here is another example (last example on that page) that doesn’t work:
YoY% = var Sales = SUM(SalesTable[SalesAmount]) var SalesLastYear=CALCULATE(Sales, SAMEPERIODLASTYEAR(‘Calendar‘[Date])) return if(Sales, DIVIDE(Sales – SalesLastYear, Sales))
This doesn’t work because the SalesLastYear var attempts to overwrite the context of the Sales var. In other words, it attempts to treat it as a measure but SalesLastYear would always return this year sales. The correct example should be:
YoY% = var Sales = SUM(SalesTable[SalesAmount]) var SalesLastYear=CALCULATE(SUM(SalesTable[SalesAmount]), SAMEPERIODLASTYEAR(‘Calendar‘[Date])) return if(Sales, DIVIDE(Sales – SalesLastYear, Sales))
The documentation should say that although one variable can reference another, it can’t overwrite its context. Also, to avoid a logical bug, the example should actually be:
YoY% = var Sales = SUM(SalesTable[SalesAmount]) var SalesLastYear=CALCULATE(SUM(SalesTable[SalesAmount]), SAMEPERIODLASTYEAR(‘Calendar‘[Date])) return if(AND(Sales, SalesLastYear), DIVIDE(Sales – SalesLastYear, Sales))
Because it’s meaningless to calculate YoY if this year or last year sales are missing.
As Microsoft announced in the “Distribute insights across the organization with Microsoft Power BI” presentation (forward to the Nikhil Gaekwad part starting at the 32 min), they’ve been releasing the following set of features to improve the end user experience in Power BI Service:
Home (not yet available) – Personalized landing page
Personal bookmarks (not yet available) – End users can create their own bookmarks
Persistent filters (already available) – Remembers filters and slicers set by end users
Conversations (dashboards conversations are available) – Dashboard and report discussions
Sharing with filters (not yet available) – Propagates the current filters when sharing individual reports and dashboards
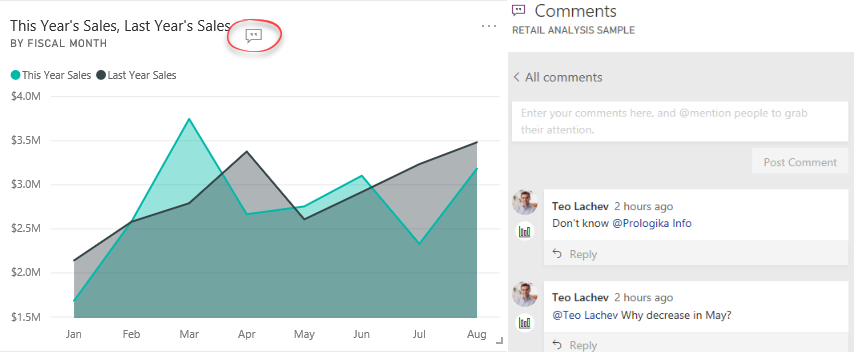
I’ve noticed that the dashboard conversations are now available. Just open a Power BI dashboard and click the Comments menu. This will open a Comments pane when you can post comments related to the entire dashboard. You can also post comments for a specific tile by clicking the tile ellipsis menu and then choosing “Add a comment”. You know that a tile has comments when you see the “Show tile conversations” button that floats on the tile. Clicking this button brings to the Comments pane to see and participate in the discussion.
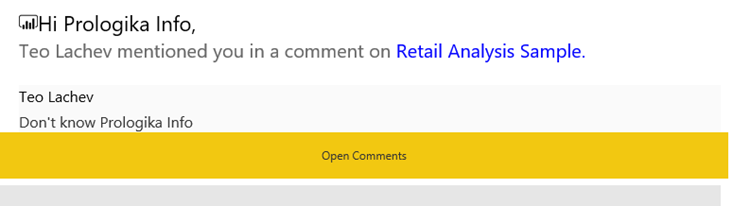
For tile-related comments, you can click the icon below the person in the Comments pane, to navigate to the specific visual that comments are associated with. Conversations are available in Power BI Service and Power BI Mobile. To avoid posting a comment and waiting someone to see it to act on it, you can @mention people as you can do on Twitter. For example, in my first comment I referenced @Prologika Info. Then that user will get an email that looks like this:
Collaboration features are not new to Power BI. Workspaces backed by O365 groups (the old-style workspaces) have supported email-based conversations. Power BI Mobile lets users annotate reports or tiles with text and emotions, and then send a screenshot to another user. Dashboard and report conversations bring collaboration a step further by allowing end users to collaborate in the context of a specific report, dashboard, or even a visual.
Usage scenario
Limitations
Workspace conversations
Workspace-level email-based collaboration
The workspace needs to be backed by O365 group.
Power BI Mobile annotations
Send annotated screenshots to other users
Power BI Mobile only; no discussion thread
Dashboard and report conversations
Discussion thread on dashboard/report/tile
Comments don’t save the state of the visual or include a screenshot of the visual if it changes after data refresh
Question: What’s the maximum dataset size Power BI can support?
Answer: As of now (Sep 1, 2018), the maximum dataset size that Power BI Pro can support is 1 GB. The maximum dataset size with Power BI Premium and Power BI Embedded is 10 GB but it depends on the SKU purchased.
Power BI Premium Plan
Power BI Embedded Plan
Max Dataset Size and Memory
P1
A1
3 GB
P2
A2
5 GB
P3 and higher
A3 or higher
10 GB
The important point is “as of now”, as with everything cloud these limits will probably get higher soon. Also, recall that Power BI compresses data well so don’t jump to conclusions of how many rows a dataset can pack if you base the estimate solely on the dataset original size. For example, a 100 MB Excel file might compress to 10 megabytes.
The limits apply to datasets after compression. So, if the file size fits the limit, Power BI will let you upload it. But what happens if the dataset size increases after the dataset memory footprint expands or if it continues to expand on refresh? For example, a 10 GB pbix file might translate to a much larger memory footprint once loaded up (due to abf compression, dictionary expansion, assorted data structures, etc.). So, even if the dataset is loaded is loaded up, there will not be enough memory to do anything useful with it like run queries, do refresh, etc. because all the physical memory is used up. So there are also limits based on the actual memory used. The documentation refers to some extra memory that Power BI grants the dataset to allow future expansion to a point, such as up to 12 GB for a 10 GB dataset.
A Power BI training or assessment won’t be complete unless I get hammered on the Power BI sharing limitations. So far, I could only mumble something to the extent of “I agree that Power BI sharing sucks big time”, look for the exit and suggest an unplanned break. Fortunately, it looks like quantitative accumulations from unhappy corporate customers have resulted in qualitative changes as Microsoft is getting serious about addressing these limitations. To me, as it stands today, the Power BI sharing is a classic example of overengineering. Something that could have been easily solved with the conventional and simple folders a la SSRS, morphed into some farfetched “cool” vision of workspaces and apps without much practical value. Let’s revisit the current Power BI sharing limitations to understand why change was due:
Workspace dependency on Office 365 groups – This results in explosion of workspaces as Power BI is not the only app that creates groups.
Any Power BI Pro user can create a workspace – IT can’t put boundaries. I know of an organization that resorted to an automated script that nukes workspaces which aren’t on the approved list.
You can’t add security groups as members – As I discussed in my blog “Power BI Group Security“, different Power BI features have a different degree of support for groups. For example, workspaces didn’t support AD security groups.
Coarse content access level – A workspace could be configured for “edit” or “view only” at the workspace level only. Consequently, it wasn’t possible to grant some members view access while others edit permissions.
(UPDATE 6/9/2019: A dataset can now be shared across workspaces) Content sharing limitations – Content can’t be copied from one workspace to another. Worse yet, content can’t be reused among workspaces. For example, if Teo deploys a self-service semantic model to the Sales workspace, reports must be saved in the same workspace.
No nesting support – Workspace can’t be nested, such as to have a global Sales workspace that breaks down in to Sales North America, Sales Europe, etc. Again, this is a fundamental requirement that any server-side reporting tool supports but not Power BI. You can’t organize content hierarchically and there is no security inheritance. Consequently, you must resort to a flattened list of workspaces.
(UPDATE 6/9/2019: A dataset can now be promoted and certified). No IT oversight – There is no mechanism for IT to certify workspace content, such as a dataset. There is no mechanism for users to discover workspace content.
UPDATE 6/27: The new Viewer role supports sharing with viewers. Sharing with “viewers” – You can’t just add Power BI Free users to share content in a premium workspace. This would have been too simple. Instead, you must share content out either using individual report/dashboard sharing or apps.
One-to-one relationship with apps – Since broader sharing requires apps (why?), an app needs to be created (yet another sharing layer) to share out workspace content. But you can’t publish multiple apps from a workspace, such as to share some reports with one group of users and another set with a different group.
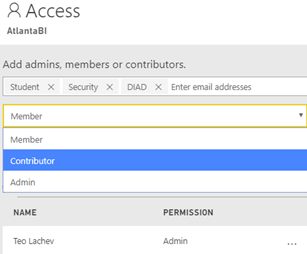
Enough limitations? Fortunately, the new workspace experience immediately solves the first four (highlighted) issues!
For example, the screenshot below shows how I can add all the O365 group types as members of a workspace (Student is individual member, Security is a security group, and DIAD is a O365 group). Moreover, two new roles, Contributor and Viewer (the Viewer role is not yet available), would further limit the member permissions. So, we finally have member-level security instead of workspace-level security.
What about the other limitations? Microsoft promises to fix them all, but it will take a few more months. Meanwhile, watch the “Distribute insights across the organization with Microsoft Power BI” presentation. So, hopefully by the end of the year I’ll have a much better sharing story to tell after all.
https://prologika.com/wp-content/uploads/2016/01/logo.png00Prologika - Teo Lachevhttps://prologika.com/wp-content/uploads/2016/01/logo.pngPrologika - Teo Lachev2018-08-26 16:06:582021-02-17 01:02:04Power BI Sharing Is Getting Better
MS BI fans, join us for the next Atlanta MS BI and Power BI Group meeting on Monday, August 28th, Tuesday at 6:30 PM at the Microsoft office in Alpharetta (our regular venue room is being renovated). If you haven’t been at the new MS office, prepare to be impressed! Mark Tabladillo, Ph.D, from Microsoft will show you how to advanced analytics with Power BI. Accelebrate will sponsor the meeting. For more details, visit our group page and don’t forget to RSVP (use the RSVP survey on the main page) if you’re planning to attend.
Presentation:
Advanced Analytics with Power BI
Date:
August 28, 2018, Tuesday
Time
6:30 – 8:30 PM ET
Place:
Microsoft Office (Alpharetta)
8000 Avalon Boulevard Suite 900
Alpharetta, GA 30009
Overview:
Power BI has become an increasingly important data analytics tool. This presentation focuses on the advanced analytics options currently available in Power BI. Attendees to this talk will see:
· Microsoft’s perspective on advanced analytics development: the Team Data Science Process
· What the general options are for advanced analytics on Azure
· What the specific native advanced analytics capabilities are in Power BI
· Some ideas on pairing Power BI with other technologies in advanced analytics architectures
Mark Tabladillo Ph.D. is a data scientist at Microsoft. His career has focused on industry application of advanced analytics, using a variety of analytics tools including SAS, SQL Server Analysis Services, Cortana Intelligence (including Microsoft R Server and Microsoft Machine Learning Services), R, and Python. He was a founding member of the Atlanta Microsoft BI User’s Group eight years ago, and this group’s second presenter.
Sponsor:
Don’t settle for “one size fits all” training. Choose Accelebrate, and receive hands-on, engaging training precisely tailored to your goals and audience! Our on-site training offerings range from ASP.NET training and SharePoint training to courses on ColdFusion, Java™, C#, VB.NET, SQL Server, and more.
Prototypes with Pizza
Featured Power BI enhancements
https://prologika.com/wp-content/uploads/2016/01/logo.png00Prologika - Teo Lachevhttps://prologika.com/wp-content/uploads/2016/01/logo.pngPrologika - Teo Lachev2018-08-23 08:12:502021-02-17 01:01:56Atlanta MS BI and Power BI Group Meeting on August 28
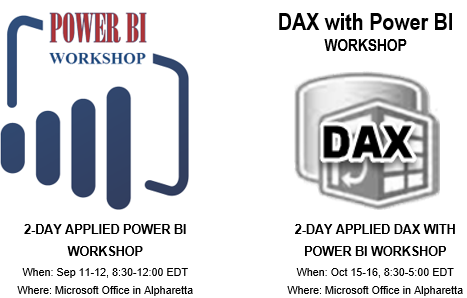
I rarely teach classes open to the public so take advantage of this exclusive opportunity to increase your data IQ! After course completion and by the end of the year, all course attendees will receive a free, one-hour, follow-up consultation with me on any Power BI or SQL Server related topic. Register today for these in-person and instructor-led training events as seating is limited.
Price: $999 (use coupon SQL201810 for an instant 5% discount if you sign up two or more attendees from your company)
For more information and to register, go to http://bit.ly/daxworkshop201810
https://prologika.com/wp-content/uploads/2016/01/logo.png00Prologika - Teo Lachevhttps://prologika.com/wp-content/uploads/2016/01/logo.pngPrologika - Teo Lachev2018-08-21 08:40:132018-09-18 07:45:25Conducting Two General Enrollment Workshops in Atlanta
As you’ve heard, data volumes are increasing and putting pressure on BI practitioners to do more with less within ever shrinking processing windows. I’ve provided some ETL best practices in various blogs, such as my “Is ETL (E)ating (T)hou (L)ive?” newsletter. A few additional considerations regarding data movement bottlenecks came from two recent projects targeting SQL Server.
Slow Network
If you’re loading data from data sources on Wide Area Network (WAN), network speed is probably going to be a major concern. While LAN enjoys speeds at around 1,000 Mbps, you’ll probably find WAN speeds to be x10 less. You can use the network tab in the Windows Task Manager to find the network throughput. The next step is to determine how much it slows down data movement using a simple approach:
Remote in to the remote server.
Open SSMS, create a query, and execute a SELECT statement from the your ETL data flow task.
Before running the query, you might want to go to the query options (Grid settings) and check “Discard results after execution” to prevent loading thousands of rows in the query grid and running SSMS out of memory.
Record the time to execute the query. This is your baseline speed that doesn’t involve the network at all.
Now remote in to the server where ETL is running and repeat the test. The delta between the two durations would tell you how much time is spent moving the data across the wire.
You now know how much the network slows down ETL but reducing network latencies might be out of your control. Hence, incremental extraction and parallel ETL execution become important.
Slow DML Operations
It’s not uncommon for BI ETL tasks to load huge datasets. Sure, you have SSD drives that got the fast I/O covered, right? Well, there are other things to check. In a recent project, we had a two-node Always On cluster for a high availability of an OLTP database. To reduce SQL Server licensing cost, the data warehouse is hosted on the cluster. Because availability group replication requires Full recovery mode, the data warehouse was configured for Full Recovery. This effectively disables minimal logging which becomes otherwise easily attainable with SQL Server 2016 or higher. Here are some stats from running a simple batch insert of 10 million rows:
Data warehouse database in Simple Recovery mode: 1:20 min
Data warehouse database in Full Recover mode: 1:34 min (no minimal logging)
Data warehouse database synchronized: 6:58 minutes!
As you can see, Full Recovery adds about 18% more overhead (besides huge logs during massive DML operations). However, the worst culprit is the synchronization between primary and secondary replicas, slowing down the overall execution time five times! You’ll know that you are waiting for replica synchronization when you see HADR_SYNC_COMMIT wait type. You can follow the steps in this blog to try reducing the cluster synchronization latency but the best strategy might be to remove the DW database from synchronization and to change its recovery mode to Simple, assuming that DW is not a mission critical resource.
All projects start simple. Adventure Works-type data loads are fast and require no optimization. But many of us are not that lucky and tackling 100s of millions (if not billions of rows) is becoming the norm. You must bend backwards to optimize data movement and reduce ETL processing windows before discovering that ETL tasks are running back to back 24×7.
https://prologika.com/wp-content/uploads/2016/01/logo.png00Prologika - Teo Lachevhttps://prologika.com/wp-content/uploads/2016/01/logo.pngPrologika - Teo Lachev2018-08-18 14:29:132018-08-18 15:33:10Finding Data Movement Bottlenecks