MS BI fans, join us for the next Atlanta MS BI and Power BI Group meeting on April 1, Monday, at 6:30 PM at the Microsoft office in Alpharetta. Considering all the the momentum behind machine learning, the main presentation will be “Microsoft Citizen Data Science with Power BI” by Stacey Jones, a Principal Data Solution Architect at Microsoft. I’ll do a brief overview of the brand new Modeling tab in Power BI Desktop. Vacation Express will sponsor the event. For more details, visit our group page and don’t forget to RSVP (use the RSVP survey on http://atlantabi.pass.org if you’re planning to attend).
Presentation:
Microsoft Citizen Data Science with Power BI
Date:
April 1 2019, Monday
Time
6:30 – 8:30 PM ET
Place:
Microsoft Office (Alpharetta)
8000 Avalon Boulevard Suite 900
Alpharetta, GA 30009
Overview:
Are you curious about Data Science? Are you a Data Scientist? If you answered yes and no to these questions respectively, this session is for you. In this session I will discuss the emerging Citizen Data Scientist role and demonstrate the emerging tools targeting this role, especially the new features in Power BI, such as AutoML
Speaker:
Stacey Jones specializes in mentoring and guiding firms in their efforts to build a modern Data, AI & BI governance programs that empower their business with Self-Service BI and Data Science capabilities. He currently serves as the Principal Data Solutions Architect at the Atlanta Microsoft Technology Center (MTC).
Sponsor:
Based in Atlanta, Vacation Express is one of the largest tour operators in the southeast United States and has been in business for 30 years. Vacation Express is a member of family-owned and operated, Toronto-based Sunwing Travel Group Inc., Canada’s leading vertically integrated leisure travel company, and has sold well over 2 million vacation packages to its exotic destinations!
Prototypes
with pizza
“The Power BI Desktop Model tab” by Teo Lachev
https://prologika.com/wp-content/uploads/2016/01/logo.png00Prologika - Teo Lachevhttps://prologika.com/wp-content/uploads/2016/01/logo.pngPrologika - Teo Lachev2019-03-26 18:07:142021-02-17 01:02:01Atlanta MS BI and Power BI Group Meeting on April 1st
At least five of the top 10 IT trends in 2019 identified by Gartner involve machine learning in one form or the other. The list includes autonomous things, augmented analytics, AI-driven development, digital twins, and immersive experience. Gartner also predicts that by 2022, at least 40 percent of new application development projects will have machine learning (ML). Therefore, it’s not surprising to see vendors making huge investments in predictive analytics. This newsletter focuses on two important Power BI enhancements for ML that will be available for public review soon: AutoML and integration with Azure Predictive Analytics services (Azure ML and Cognitive Services).
AutoML
The problem with machine learning is that it’s hard and there aren’t that many data scientists out there (or least ones that you can afford). The promise of AutoML is to bring predictive analytics to data analysts just like self-service BI brought descriptive analytics to business users. Power BI AutoML is based on another recent technology introduced by Microsoft: ML.NET. ML.NET is for .NET developers who want to incorporate machine learning features in .NET apps without external dependencies or tools.
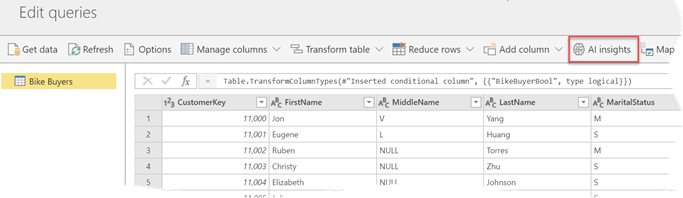
As it stands, Power BI AutoML requires a premium capacity (either via Power BI Premium or Power BI Embedded). The process starts with the data analyst creating an entity containing the data to be predicted. For example, the entity might return a list of customers who have purchased a product in the past with some fields that the data analyst believes are significant to “convert” a customer into a buyer, such as demographics fields. Then, the data analyst can use AutoML to create a predictive model that forecasts the likelihood of future customers to purchase a product. This could be useful for a targeted campaign or to implement “customers who purchased this product have also purchased another product” but many other ML scenarios are possible. The process for implementing an AutoML model is simple and starts with clicking the AI Insights button on the entity page.
This starts a wizard that walks the data analyst through a few steps that I described in more detail in my “First Look at Power BI AutoML” blog. In the same blog, I shared some ideas to simplify the experience even further that I hope Microsoft will implement.
Integration with Azure ML and Cognitive Services
While AutoML is a “quick and dirty” way for data analysts to implement predictive models, data scientists need more control. They have many tools in the Microsoft ecosystem, ranging from R and Python in SQL Server to cloud-based PaaS services, such as Azure ML. One of the easiest tool is Azure ML.However, currently Power BI doesn’t integrate natively with Azure ML experiments, so you must resort to using the Web connector to call the experiment’s web service. I demonstrate how you can do this in a singleton way (one row at a time) in chapter 11 of my latest Power BI book (you can download the code from the book page). This method is still available but it’s cumbersome to implement and it’s slow.
It simplifies the integration with Azure ML and Cognitive Services – In the case of Azure ML, all you have to do is to select the predictive web service and map the source columns as input to the model. Power BI will invoke the web service and add new predictive columns (in this case, to predict if the customer will be a buyer and the probability for this to happen).
It’s much faster – Power BI calls the service in batch mode, which is significantly faster than predicting one row at the time.
The Cognitive Services integration works in a similar way. It allows you to augment your Power BI data with cognitive features, such as sentiment analysis and image recognition. For more information, watch the related announcements: integration with Cognitive Services and Azure ML, and the new Auto ML features (skip to 1:08:30).
The forthcoming AutoML and Integration with Azure ML and Cognitive Services will be major enhancements to the Power BI predictive analytics capabilities. Both features will be available in public preview soon.
Teo Lachev
Prologika, LLC | Making Sense of Data
Microsoft Partner | Gold Data Analytics
Scenario: If you want to pass an input table to a DAX query. For example, you might have an application that lets the user specify a subset of customers and as-of dates for each customer. Your query needs to calculate certain metrics, such as Sales, for the list of customers but as of the user-specified date for each customer, and potentially other parameters. It’s impractical to save these parameters in a physical table in your database because this requires a processing task. You may also want to avoid Analysis Services placing locks on the database for each refresh and thus blocking pending queries. Instead, you want to simply pass a collection of all the parameters the query needs to do its job, inside the query.
Solution: DAX supports static tables using the DATATABLE function, but the resulting data table is very limited in its support of features. First, you can’t name the table in your query, so you need to resort to using a variable. More importantly, many DAX operations that reference columns, such as attempting to compute MAX of a table column to get the “current” value, will error with “Table variable ‘_filter’ cannot be used in current context because a base table is expected”. You can’t also create physical relationships to a custom data table.
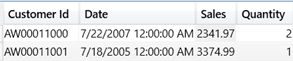
However, you can use TREATAS to establish virtual relationships based on the input parameters in the input table. The following query has a _filter variable that points to a custom data table that contains two customers with corresponding as-of dates. Then, the query uses TREATAS to evaluate the sales and order quantity for each customer as of the specified date. You can run this query against the AdventureWorks Tabular Model that comes with the SSAS samples.
One cautionary note here is that the cost of such “per-row” virtual relationships could be very expensive. When possible, you should always favor “batch”-oriented execution where the query uses global filters and physical relationships.
Thanks to Darren Gosbell and Marco Russo for helping with this.
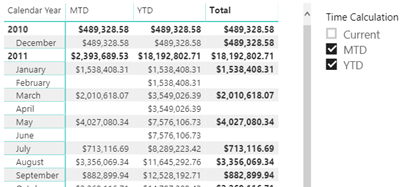
Just when I started thinking that there won’t be any new BI features in SQL Server 2019, Christian Wade announced DAX calculation groups in CTP 2.3. His excellent post helped me try them out with Tabular Editor and Power BI Desktop and whip out this cool report.
As Chris Webb pointed out, DAX calculation groups let us implement time calculations as in Multidimensional with a “shell” time dimension. They probably won’t help you reducing the number of measures because you’d still need to flatten the “shell” dimension for maximum flexibility and avoid forcing the user to use the Time Calculations slicer to select the time calculations they want on the report. So, you would still have to project Sales Amount YTD as a separate measure:
What calculation groups help with is avoiding copying and pasting the time intelligence formulas all over the place. A future CTP will also help centralize measure formatting where you’ll have the option to inherit the current measure format string (by leaving it blank), or override it.
To me, DAX calculation groups is a nice to have feature, which I could have happily traded for more significant ones. Speaking of which, I hope Microsoft adds more important enhancements to Tabular 2019.
Here is my top 10:
Anything that can help the poor developer debug and understand in what context a DAX expression is evaluated as DAX tends to have more exceptions than rules.
DAX script – to show and organize all measures in one place. I miss also the MD scope assignments.
In my previous “First Look at the New Power BI Integration with Azure ML” blog, I showed you how Power BI will make it very easy to integrate it with Azure Machine Learning and Cognitive Services. Data scientists today have plenty of options to create predictive models but all of them have one thing in common: expertise in data science and statistics.
The promise of AutoML is to bring predictive analytics to data analysts just like self-service BI brought analytics to business users.
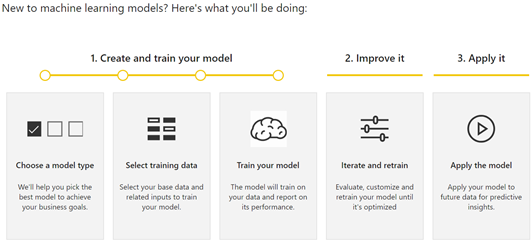
Let’s see how AutoML works based on what’s in the private preview (the usual disclaimer is that things will probably change). To start with, AutoML requires a dataflow (a note to Microsoft here is that AutoML will become more pervasive if it’s available in Power BI Desktop and it doesn’t require a premium capacity). In the private preview, AutoML requires the following steps. Presumably. the first (and most difficult step), preparing the dataset and cleansing the data is already done and available as a dataflow entity:
Choosing model type
In private preview, choosing a model type requires the data analysts to select one of four model types:
Binary Prediction – a type of a classification task where the model predicts only two (Boolean) states, such as if a customer is a potential buyer or not. It requires a Boolean outcome field.
General Classification – a type of a classification task where the model predicts more states, such as if the customer’s risk falls in Low, Medium, or High risk.
Regression – Similar to classification, regression predicts a numeric outcome, such as the customer risk on the scale from 0 to 10.
Forecasting – Time series forecasting, such as to predict the revenue for future months.
I’d argue here that if want to make this super easy, we shouldn’t be asking a business user about the type of model. Power BI can simply examine the field that needs to be predicted, which happens in the next step, and suggest the model type so the current choices can be collapsed between Classification and Forecasting.
Selecting training data
Next, you need to select the field that needs to be predicted (outcome field) and input columns. This step is the most important and arguably the most difficult even for data scientists because you need to have a business domain knowledge to guess which input fields are the most significant. Modelers tend to lean on the safer side by selecting all fields which dilutes the model accuracy. Here, it will be nice if AutoML suggests which fields are the most significant. AutoML has a validation report that shows you the key influencers after the model is ready, but it would be better if it has similar feature to aid you in the field selection.
The wizard’s next step depends on the mode type. For binary classification, it asks you to specify the field names for two states, such as Buyer and NonBuyer.
Training the model
The model is ready but requires an entity refresh to train it. At this point, AutoML generates two additional entities for providing inputs for testing and training data, such as 80% of the input dataset is used to train the model (generate the predictive patterns) and 20% is used to test the model accuracy against the historical data. The assumption here is probably let the user to fine tune the training and testing data if they want to have more control. I think though that this is too technical, and it should be handled internally by AutoML to reduce the number of entities and overall complexity.
The actual model exists on the Power BI capacity. All the training happens there, and the resulting patterns are stored there. Data does not leave the capacity and the model is not published as an experiment in Azure ML.
Iterating and retraining
One thing is to prepare the model, which is easy with AutoML, but another thing is to make sure that the model is useful and results in a true gain. This is where things get technical but AutoML seeks to simplify this with a validation report. The report has three tabs:
Model Performance – The most important information here is the key influencer charts that show you which input fields are the top predictors. You should review this chart and possibly remove input fields that are insignificant. This page also has the only input change you can make to influence the model prediction, which is to specify the probability threshold. For example, for Binary Prediction you can change the probability threshold to 50% to indicate that the customer is considered a buyer if the predicted score is equal or above 50%.
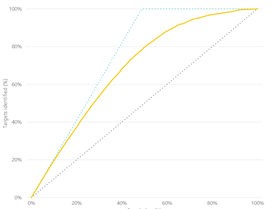
Accuracy Report – The most important information on this page is the so called lift chart. You want to verify here that the solid line is above the diagonal line which represents a random guess, i.e. if we don’t use predicative analytics but just randomly guess which customers will become buyers.
Technical Details – This page has additional technical information which will be over the head of data analysts but could be useful to pass them on to the data scientist, such as what parameters were used for the model algorithm.
Applying the model
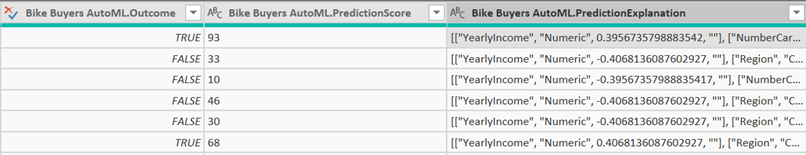
Now that you have the model trained, you can operationalize it by applying it to your original entity, that was used to train the model, or to another entity, such as a list of new customers, as long as it has the same fields that are used as input to the model. Applying the model to an entity adds yet another (computed) entity which has the original fields, plus the predicted. For example, the Binary Prediction model type adds two new fields:
Outcome – TRUE if the model predicted that the customer will be a buyer and FALSE otherwise.
PredictionScore – The likelihood of the prediction from 0 to 100.
PredictionExplanation – Additional details that include the weights of each input field to explain the predicted outcome.
So, once all is done, you’ll have 7 entities:
Original entity
AutoML entity – trains the model
Training data – entity used for training the model
Testing data – entity used for testing the model
AutoMLScore – a function used for scoring the input dataset
AutoMLPollingQuery – a helper entity which I believe returns the identifier of the model
I’d personally prefer less entities. For example, I’d rather see the predicted fields added to the entity to which the model is applied to, as opposed to having another “enriched” entity.
Power BI AutoML brings predictive analytics to data analysts. Powered by ML.NET, AutoML automates the creating of predictive models to handle common predictive tasks, such as classification and forecasting. I hope Microsoft simplifies the process by reducing the number of entities and refreshes required, and by bringing AutoML to Power BI Desktop.
https://prologika.com/wp-content/uploads/2016/01/logo.png00Prologika - Teo Lachevhttps://prologika.com/wp-content/uploads/2016/01/logo.pngPrologika - Teo Lachev2019-03-03 11:28:212019-03-03 11:31:43First Look at Power BI AutoML
Currently, Power BI doesn’t integrate natively with Azure ML so you must resort to using the Web connector to call the experiment’s web service. I demonstrate how you can do this in a singleton way (one row at a time) in chapter 11 of my latest Power BI book (you can download the code from the book page). Microsoft announced several forthcoming Machine Learning enhancements, including integration with Cognitive Services and Azure ML, and the new Auto ML features (skip to 1:08:30).
In this blog, I’ll review the Power BI integration with Azure ML, which is currently in private preview but expected to be available for public preview soon. I’ll use the Adventure Works Bike Buyer Azure ML predictive model (explained in more detail in my book). The predictive model is simple. The model is trained with data from the vTargetMail view in the AdventureWorksDW database and predicts the probability of a customer to purchase a product based on a small subset of features, such as the customer age, geographic region, house owner, number of cars owned, etc.
When you publish the web service in Azure ML, you must use the Deploy Web Service [New] Preview option. Power BI integration won’t work if you deploy it as a classic web service. There are more prerequisites required to enable integration to Azure ML and Cognitive Services, such as granting the consumers specific rights, which will be documented. Currently, this integration scenario is available in Power BI Service dataflows only. In addition, the dataflow must be created in a premium capacity and the AI Insights workload must be enabled.
Those of you who had to use the Web connector in the past to integrate Power BI with Azure ML will appreciate the simplicity of the new integration:
Create a dataflow with an entity of the dataset you want to score.
Click the AI Insights button in the entity toolbar. If you don’t see this button, the capacity is not a premium capacity, or the AI Insights workload is not enabled.
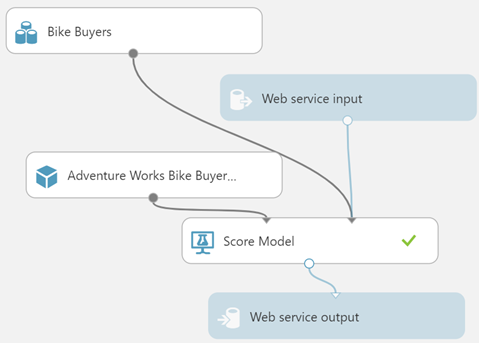
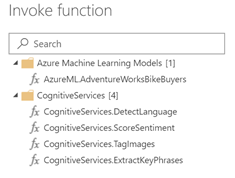
Power BI enumerates all “new style’ web services assigned to price plans in the Power BI tenant (could be in different subscriptions) and show them in the Invoke Function window (the screenshot below shows only one web service).
Once you select the Azure ML service, Power BI will ask you to map the columns in your data entity as input columns (features) to the web service.
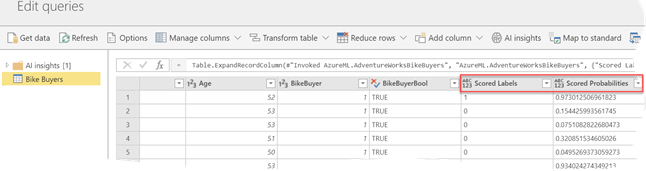
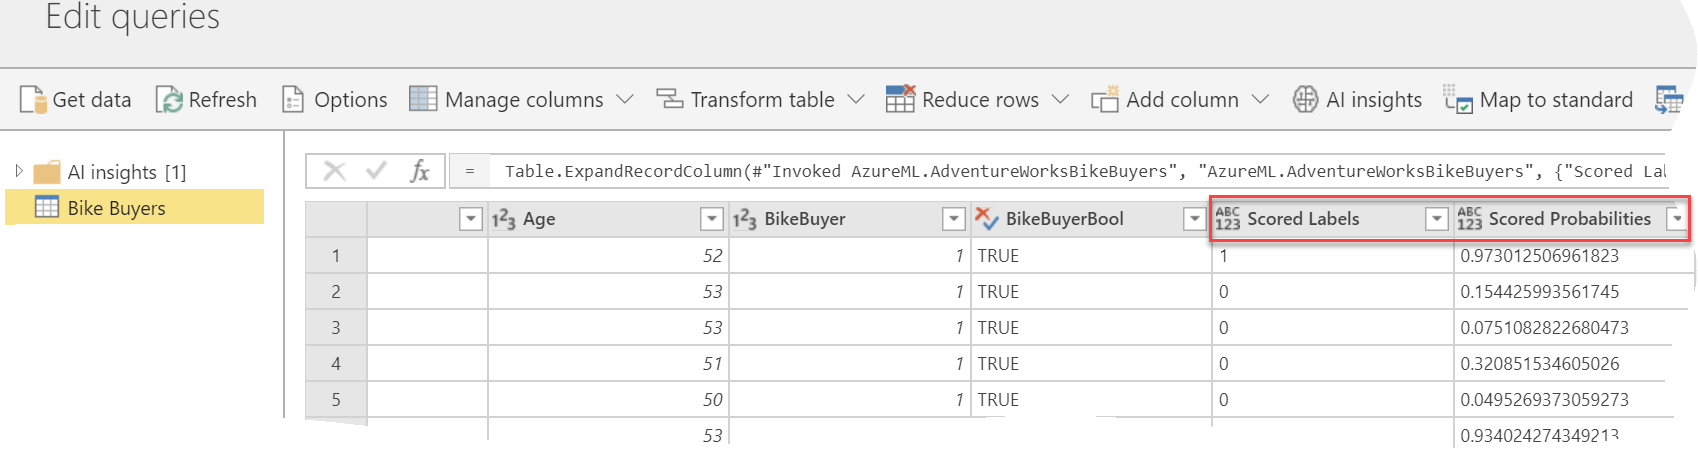
Next, Power BI adds a new “AzureML.WebServiceName”column to the entity dataset. Specifically, Power BI invokes the Azure ML web service in batch mode, which is more efficient that calling one row at the time. The underlying invocation and integration details with Azure ML are not available to you.
You can expand the new column to get the scored label and probability. That’s it! That’s exactly how I imagined the Azure ML integration to work and I’m glad to see how easy it is.
The new Power BI-Azure ML integration makes it very easy for a data analyst to score a dataset against a previously published (presumably by a data scientist) Azure ML experiment. In the preview, this integration requires a premium capacity and dataflow. I hope Microsoft brings this integration scenario to Power BI Desktop too.
https://prologika.com/wp-content/uploads/2016/01/logo.png00Prologika - Teo Lachevhttps://prologika.com/wp-content/uploads/2016/01/logo.pngPrologika - Teo Lachev2019-03-02 15:45:092019-03-02 18:54:13First Look at the New Power BI Integration with Azure ML

 At least five of the top 10 IT trends in 2019 identified by Gartner involve machine learning in one form or the other. The list includes autonomous things, augmented analytics, AI-driven development, digital twins, and immersive experience. Gartner also predicts that by 2022, at least 40 percent of new application development projects will have machine learning (ML). Therefore, it’s not surprising to see vendors making huge investments in predictive analytics. This newsletter focuses on two important Power BI enhancements for ML that will be available for public review soon: AutoML and integration with Azure Predictive Analytics services (Azure ML and Cognitive Services).