The Power BI Viewer Role

As I discussed in “Power BI Sharing is Getting Better” and “Power BI Sharing is Getting Better 2“, the Power BI sharing saga has been improving and Microsoft is closing gaps. As recently announced, Microsoft added an important Viewer role that grants view permissions to the workspace content.

The most important part in the announcement is:

“Viewer role requires a Pro license or for the content to be in Power BI Premium. If your workspace is in Premium, users with Viewer role who don’t have a Pro license can view the workspace in the workspaces list, navigate to the workspace, and view the content without getting a Pro Trial prompt.”

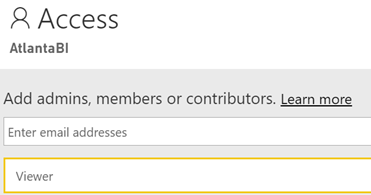
Therefore, the Viewer role lifts a significant limitation that forced you to use report/dashboard sharing or apps to share content out of a premium workspace with viewers. So, if you want to share the entire content of the workspace, now you don’t have to use apps. You can simply add users or groups as viewers to the workspace.

Speaking of apps and selective sharing, my joy will be complete once workspaces supports nesting (folders) with the ability to overwrite the securing permissions at a folder level so we can have SSRS-like folder-based security. This will allow you to organize content anyway you want (instead of resorting to a flatten list of workspaces) and grant selective permissions to different groups of users. Now I have a much better Power BI sharing story to tell!

Why Is SQL Server Not Using My Index?

Scenario: A partitioned Tabular table generates SELECT statements that queries a massive range from the base table on a date column. The processing job is taking long time. The SELECT query plan shows Clustered Index Scan but there is an index on the date column.

Why is SQL Server not using the index? Surely, it will speed things up, right? This is where the blaming game starts…

Analysis: SQL Server might ignore the index if the range is too wide. For example, these two queries will probably hit the index on the LastUpdated column in a 300 million rows table because the range is very narrow.

select from FactAccountSnapshot with (index(IX_FactAccountSnapshot_LastUpdated)) where LastUpdated ‘1/1/2019’

select from FactAccountSnapshot with (index(IX_FactAccountSnapshot_LastUpdated)) where LastUpdated between ‘1/1/2019’ and ‘1/2/2019’

This query will probably not:

select from FactAccountSnapshot where LastUpdated between ‘1/1/2019’ and ‘1/31/2019’

Why? Because the server might determine that is much faster to scan the entire table instead of doing many lookups against the index. To test this out, you can force the query to use the index:

select from FactAccountSnapshot with (index(IX_FactAccountSnapshot_LastUpdated)) where LastUpdated between ‘1/1/2019’ and ‘1/31/2019’

Only the find out that it takes x5 more to fetch the data (in this example, 1:37 minutes versus 24 seconds with the table scan).

Conclusion: SQL Server is smarter that you might think. Indexes may benefit queries with narrow ranges. The wider the range, the less likely it will result in an index hit. And this is a good thing. BTW, in this particular case, the performance issue was not related to SQL Server at all.

Tip: Assuming good hardware and proper conditions (good query throughput (no massive joins in views), good network throughput, narrow fact table, etc.), Analysis Services should be able to process 100,000 rows/sec on a single thread. So, a 300 million rows table should process in less than an hour. Even better, if you partition it, each partition will process in parallel so with five partitions (five parallel processing threads), you should aim at around 15-20 minutes to fully process this table. Even better, process only the partitions with data changes to bring the query processing window further down.

Multi-level Column Unpivoting with Power Query

An interesting challenge today come up while mentoring finance users in Power BI. Consider the following Excel layout.

061919_0107_MultilevelC1.png

The user wants to unpivot the data by rotating the three header rows (Scenario Type, Month, and Year) from columns to rows. The issue is that the headers span three rows. If you just select these columns and unpivot, you’ll end up with a mess. And Power Query operates on row at the time so you can’t reference previous rows, such as to concatenate Scenario, Month, and Year. We can do the concatenation in Excel so we have one row with column headers, such as Actuals-Jan-2018, Actuals-Feb-2018, and so on, which we can easily unpivot in Power Query. But if we can’t or don’t want to modify the Excel file, such as to avoid the same steps every time a new file comes in?

One way to achieve a Power Query-only solution is to transpose the rows. Then, we can apply the required transforms, such as filling down, creating a new column that concatenates the three columns and so on.

061919_0107_MultilevelC2.png

Then, we transpose back and unpivot. You can download the Excel file with the Power Query transforms using this link.
UnpivotBudget

Prologika Newsletter Summer 2019

090918_1951_DAXVariable1.png
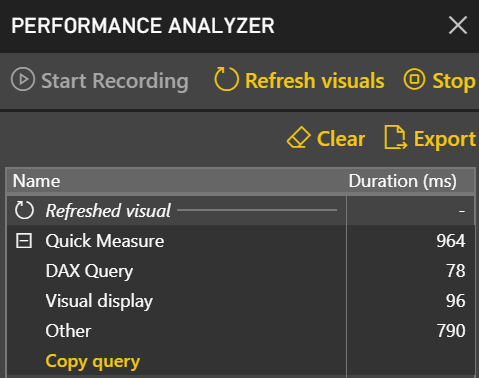
After learning how to model the data properly (the most important skill), DAX would be the next hurdle in your self-service or organizational BI journey. You won’t get far in Microsoft BI without DAX. This letter shares a tip on how to identify DAX performance bottlenecks by using a recent feature in Power BI called Performance Analyzer.

Learning DAX

DAXBefore I get to Performance Analyzer, I’m excited to announce my latest book: Applied DAX with Power BI: From zero to hero with 15-minute lessons. This book was born out of necessity. In my consulting practice, I had been teaching and implementing Power BI and Analysis Services Tabular, and people were constantly asking for DAX book recommendations. Indeed, DAX is not an easy topic and has its ways to humble even experienced practitioners. There are a few good reference books out there, but they could be somewhat overwhelming for novice users. So, I turned my classroom and consulting experience into this book and designed it as a self-paced guide to help you learn DAX one lesson at a time.

This one was a different book to write. Unlike my other books, which tend to be heavy, this book is smaller (220 pages). Regardless, it took me a while to write it. The book also adopts a lesson-based approach, so the reader can learn and practice a specific DAX concept quickly. There are usually three sections in each lesson: Practice (with step-by-step guidance), Outcome (a visual that shows the result), and Analysis (explaining why DAX works this way). Most lessons are five to six pages long, and it should take no more than 15 minutes to complete the lesson’s exercises (you can download and view a sample lesson from the book page).

And if you do one lesson per day, you’ll be a DAX expert in a month!

Analyzing DAX Queries

“This report is slow!” I hope you never hear this, but the chances are that you will sooner or later. No one likes watching a spinning progress indicator and waiting for the report to show up. Tucked in the View ribbon of the Power BI Desktop recent builds is a handy tool called Performance Analyzer that can help you identify slow queries. It’s easy to use:

  1. In Power BI Desktop, click the View ribbon and check the Performance Analyzer setting. This will open the Performance Analyzer pane.
  2. Click Start Recording in the Performance Analyzer pane. Once you start recording, any action that requires refreshing a visual, such as filtering or cross-highlighting, will populate the Performance Analyzer pane. You’ll see the statistics of each visual logged in the load order with its corresponding load duration.
  3. You can click the “Refresh visuals” link in Performance Analyzer to refresh all visuals on the page and capture all queries. However, once you are in a recording mode, every visual adds a new icon to help you refresh only that visual.

PerformanceAnalyzer

Performance Analyzer captures the following information:

  • DAX query – The length of time to execute the query.
  • Visual display – How long it took for the visual to render on the screen after the query is executed.
  • Other – This is the time that the visual spent in other tasks, such as preparing queries, waiting for other visuals to complete, or doing some other background processing.

Although not as comprehensive as DAX Studio, Performance Analyzer is a quick and easy way to get an overall idea of what impacts your report page performance. Performance Analyzer is currently only available in Power BI Desktop and it’s not available in Power BI Service.


Teo Lachev
Prologika, LLC | Making Sense of Data
Microsoft Partner | Gold Data Analytics

logo

Power BI Sharing is Getting Better 2

We had to wait four years but here they are: Power BI shared datasets are here. This makes it a good time to revisit the remaining Power BI sharing limitations, which I listed in my previous blog on the same subject.

  1. No nesting support – Workspaces can’t be nested, such as to have a global Sales workspace that breaks down to Sales North America, Sales Europe, etc. You can’t organize content hierarchically and there is no security inheritance. Consequently, you must resort to a flattened list of workspaces. Microsoft has hinted about subfolders, but no further details are provided about how they will work and ETA.
  2. UPDATE 6/27: The new Viewer role supports sharing with viewers. Sharing with “viewers” – You can’t just add Power BI Free users to share content in a premium workspace. This would have been too simple. Instead, you must share content out with either individual reports/dashboards or apps. A Viewer role has been in the works to address this, but no official release date yet.
  3. One-to-one relationship with apps – Since for some obscure reason that only Microsoft knows, broader sharing requires apps, an app needs to be created (yet another sharing layer) to share workspace content to a broader audience. But you can’t publish multiple apps from a workspace, such as to share some reports with one group of users and another set with a different group. Hopefully, the forthcoming Viewer role will remove this limitation and de-emphasize apps, which in my opinion add unnecessary complexity without bringing much business value.

It’s nice to share and it’s good to see that Power BI is making it simpler but more is needed to bring sharing to where it should be.

Power BI Palooza

May was a hectic month but June is even busier… I’m presenting and sponsoring the tomorrow’s Power BI Group meeting and teaching a class on Tue and Wed. Then, on Saturday Guys in the Cube and I are kicking off the Power BI Palooza event at the Microsoft office in Alpharetta at 8:30 AM. I’m presenting “10 Ways to Empower Your BI Strategy with Power BI”. Then the week after I’m teaching another class…

The Palooza organizers said the event was sold out a few days after the announcement. If you’re of the lucky confirmed, here is my presentation’s abstract.

Not sure what value Power BI can bring to your BI strategy? Join me to discuss 10 ways Power BI can help augment your existing or envisioned Power BI strategy. If you’re interested in Power BI but you’re not sure how it fits within your organizational data strategy, this event is for you. Discussion points include:

  • Organizational BI
  • Self-service BI
  • Cloud vs. on-premises deployments
  • Predictive analytics
  • External reporting
  • Integrated solutions

Get your Power BI questions answered and see demos along the way.