Prologika Newsletter Winter 2019

Happy Holidays! I hope you’re enjoying this special time of the year. A few months ago, I did an assessment for a large company that was advised by an undisclosed source that they should use their Dynamics Financials and Operations (F&O) system as a data warehouse. Recently, I came across a similar wish but this time to use SAP as EDW. Can we do this? But before I give you my opinion, I’m excited to announce the availability of the fifth edition of my “Applied Microsoft Power BI” book – the only Power BI book that it’s updated every year to keep it up with the ever-changing world of Power BI and the Microsoft Data Platform! The book is making slowly its way to the retailers and it should be available on Amazon in the first days of 2020.

Operational Reporting

I understand that everyone wants to do more with less and shortcuts are tempting. But ERP systems are systems of record, just like any other data source. True, they could own most of the core data that you need for analytics. But that data is normalized and stored in a format that’s not conducive for analytics. To make things worse, Dynamics doesn’t even give you direct access to its SQL Server database on your production instance. You must go through REST APIs or export data to gain access to it. And to add new tables, you must create entities in Visual Studio! Still want to build a data warehouse in Dynamics?

ERP systems typically have some reporting features, but these features typically deliver only operational reporting. Operational reporting has a narrow view concerned with “now”, such as a report that shows customers with outstanding balances as of today. For example, Dynamics comes with standard SSRS reports. You could also enable analytical workspaces that deliver reports via Power BI Embedded. These reports, however, are operational reports. By contrast, BI is mostly concerned with historical and trend analysis.

BI Axioms

In math, axioms are statements that are assumed to be correct without a proof. We need BI axioms and the list can start like this:

  • Every mid to large company shall have a centralized data repository for consolidating trusted data that is optimized for reporting. The necessity for such a repository is in a direct correlation with the number of the data sources that must be integrated (that number will increase over time) and the complexity of the data transformation. The centralized data repository is commonly referred to as a data warehouse.
  • Dimensional modeling shall be the methodology to design the data warehouse schema. I know it’s tempting to declare your ODS as a data warehouse, but highly normalized schemas are not suitable for reporting.
  • If you’re after a single version of the truth, you shall have an organizational semantic layer. Find why you need it in my “WHY SEMANTIC LAYER?” newsletter.
  • ERP systems are not a replacement for a data warehouse. Neither are data lakes and Big Data.
  • You shall have both organizational and self-service BI, and they should complement each other. If you lean too much toward organization BI, you’ll get a backlog of requirements. If you lean too much toward self-service BI, you’ll end up with fragmented “spreadmarts”, which is where you probably started.
  • Most of the BI effort shall go toward organizational BI to integrate data, improve data quality, and centralize business calculations. Tools come and go but this effort shall endure.
  • Agile and managed self-service BI shall fill in the gaps. It should provide a feedback loop to extend organizational BI with data that the entire organization can benefit from.


Teo Lachev
Prologika, LLC | Making Sense of Data
Microsoft Gold Partner | Data Analytics

logo

APPLIED MICROSOFT POWER BI (5th Edition)
 (BRING YOUR DATA TO LIFE!)

Applied Power BI (5th Edition)Bring your data to life today and learn how Power BI changes the way everyone gains insights from data.

    • Publication date: 1/1/2020
    • Size: 528 pages, 7.5″ x 9.25″
    • Price: $49.99
    • ISBN 10: 1-7330461-1-9
    • ISBN 13: 978-1-7330461-1-4

Introduces information workers, data analysts, IT pros, and developers to Microsoft Power BI — a cloud-hosted, business intelligence and analytics platform that democratizes and opens BI to everyone, making it free to get started!

Power BI changes the way you gain insights from data; it brings you a cloud-hosted, business intelligence and analytics platform that democratizes and opens BI to everyone. It does so under a simple promise: “five seconds to sign up, five minutes to wow!”

Synopsis

An insightful tour that provides an authoritative yet independent view of this exciting technology, this guide introduces Microsoft Power BI—a cloud-hosted, business intelligence and analytics platform that democratizes and opens BI to everyone, making it free to get started!

Information Workers will learn how to connect to popular cloud services to derive instant insights, create interactive reports and dashboards, and view them in the browser and on the go! Data Analysts will discover how to integrate and transform data from virtually everywhere and then implement sophisticated self-service models for deccriptive and predictive analytics. The book also teaches BI and IT Pros how to establish a trustworthy environment that promotes collaboration, and they’ll implement Power BI-centric solutions for organizational BI. Developers will find out how to integrate custom applications with Power BI, to embed reports, and to implement custom visuals to effectively present any data.

Ideal for both experienced BI practitioners and beginners, this book doesn’t assume you have any prior data analytics experience. It’s designed as an easy-to-follow guide that introduces new concepts with step-by-step instructions and hands-on exercises.


What’s inside

  • Get insights from popular cloud services on any device!
  • Implement sophisticated personal BI models!
  • Enable team BI and implement descriptive, predictive, and real-time BI solutions!
  • Extend Power BI with custom visuals and report-enable custom apps!
    …and much more!

Resources

Front matterSample chapter (Chapter 1)Errata
IndexSource codeForum
Back coverFirst edition page
Second edition page
Third edition page
Fourth edition page

Reviews

“The true power in Power BI cannot be appreciated without understanding what the offering can do and how to best use it. That is why resources like this fantastic book will become instrumental for you. This book starts by providing an overview of the main components of Power BI. It introduces Power BI Desktop, data modeling concepts, building reports, publishing and designing dashboards. Readers will be up and running in no time. It then moves on to bring you up to speed on deeper dive topics such as data gateways, data re-fresh, streaming analytics, embedding and the Power BI data visualization API. Not only is Teo one of the first people in the world to learn and write about Power BI 2.0, he also brings a wealth of knowledge from deploying the first real-world implementations. Much like Teo’s previous books on Analysis Services and Reporting Services, this Power BI book will be a must read for serious Microsoft professionals. It will also empower data analysts and enthusiasts everywhere.”

Jen Underwood
Principal Program Manager, Microsoft Business Intelligence

“I’m impressed about the breadth of the topics covered by Teo Lachev in this book, I’ve just took a quick look at every chapter, and Teo covered all the topics at least at the point where you can start doing something (and in some chapter also more than just an intro). Considering the speed of Power BI releases and the effort required in writing a book, I know the huge effort behind this. My kudos to this book!”

Macro Russo
Consultant, SQLBI


How to purchase

Buy the paper copy from Amazon
Buy the Kindle ebook from Amazon


Power Platform World Tour

Organized by Microsoft and Dynamic Communities, the Power Platform World Tour will take a place in Atlanta from 2/10-2/12, 2020. I’m teaching Power BI Dashboard in a Day (DIAD) on Feb 10 for a full day. Although this is a paid event ($599), you should get a great business value as the audience will probably be smaller and I’ll be able to provide more personal attention. Then, I’ll present “Bridge Analytics and Developer Worlds with Power Platform” on Feb 12 and show how Power BI can integrate with Power Apps to allow you to change the data behind a report.

Power BI Incremental Refresh

Power BI incremental refresh (a Power BI Premium feature) refreshes a subset of a table with imported data. The main goal is to reduce the refresh time so that new data becomes available online faster. Patrick LeBlanc has a great video about how to make the incremental refresh even more incremental by using the “Detect data changes” feature and he explains in detail how it works.

What if you want to fully refresh the dataset set up for incremental refresh? For example, you configure a table for incremental refresh periodically, but you want to fully process the dataset nightly, such as to pick the latest changes to dimensions. Currently, the only option to fully refresh the dataset with an incremental refresh policy is to republish the dataset and refresh it (this works because the first refresh is always full). When the XMLA endpoint becomes writeable, you’ll have the option to do so in an XMLA script. For example, the following script fully refreshes the InternetSales table without applying the refresh policy settings. Notice also the effectiveDate setting that allows you to overwrite the current date for testing purposes.

{

“refresh”: {

“type”: “full“,

applyRefreshPolicy“: false,

“effectiveDate”: “10/24/2019”,

“objects”: [

{

“database”: “AdventureWorks”,

“table”: “InternetSales”

} ] } }

BI Axioms

A few months ago, I did an assessment for a large company that was advised by an undisclosed source that they should use their Dynamics Financials and Operations (F&O) system as a data warehouse. Recently, I came across a similar wish to use SAP as a data warehouse. I understand that people want to do more with less and shortcuts are tempting. But ERP systems can’t fulfill this purpose, and neither can other systems of record. True, these systems might have analytical features, but these features typically deliver only operational reporting. Operational reporting has a narrow view concerned with “now”, such as a report that shows customers with outstanding balances as of today. By contrast, BI is mostly concerned with historical and trend analysis.

In math, axioms are statements that are assumed to be correct without a proof. We need BI axioms and the list can start like this:

  • Every mid to large company shall have a centralized data repository for consolidating trusted data that is optimized for reporting. The necessary for such a repository is in a direct proportion with the number of the data sources that must be integrated (that number will increase over time) and the complexity of the data transformation. The centralized data repository is commonly referred to as a data warehouse.
  • Dimensional modeling shall be the methodology to design the data warehouse schema. I know it’s tempting to declare your ODS as a data warehouse, but highly normalized schemas are not suitable for reporting.
  • If you’re after a single version of the truth, you shall have an organizational semantic layer.
  • ERP systems are not a replacement for a data warehouse. Neither are data lakes and Big Data.
  • You shall have both organizational and self-service BI, and they should complement each other. If you lean too much toward organization BI, you’ll get a backlog of requirements. If you lean too much toward self-service BI, you’ll end up with fragmented “spreadmarts”, which is where you probably started.
  • Most of the BI effort should go toward organizational BI to integrate data, improve data quality, and centralize business calculations. Tools come and go but this effort shall endure.
  • Agile and managed self-service BI shall fill in the gaps. It should provide a feedback loop to extend organizational BI with data that the entire organization can benefit from.

Tips for Extended Events

Load testing and troubleshooting Analysis Services often requires capturing a query trace. The lightweight option to do so is to create an Extended Events (xEvents) session. Let’s say you want to capture all query traffic for 24 hours. You might opt to use the SQL Server Profiler, but it’s implemented as a desktop app (there must be an active Windows session but what happens if the Profiler crashes or corporate policy logs you out?) and it may impact the performance of your production server. The recommend way is to set up an xEvents session that logs the required events (same events you see in SQL Server Profiler) to a *.xel file.

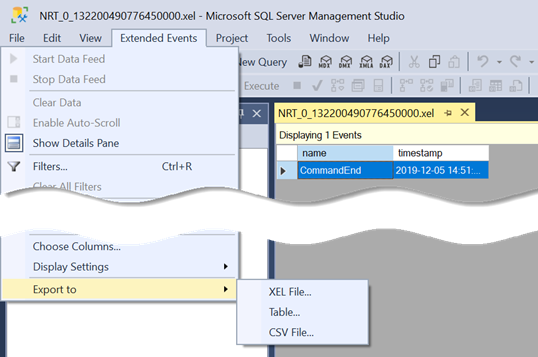
What’s not so obvious is how to analyze the file. The easiest way is to open the .xel file in SQL Server Management Studio (SSMS). You’ll see a new Extended Events menu added to the menu bar. Among other things, this menu allows you to export the trace to a SQL Server table!

120919_0020_TipsforExte1.png

What makes an xEvents session even more useful is that it allows you to correlate events. For example, for some obscure reason the Analysis Services PropertiesList info is only available in the QueryBegin event. However, capturing the QueryEnd event is good enough because it gives you all the info you need, such as the query duration, query statement, database name, etc. But what if queries come from a Power BI report via a gateway to an on-prem SSAS instance? In this case, the user identity is in the PropertiesList info because the gateway uses a trusted account to connect to SSAS. So, now you must capture QueryBegin if you want to know who sent the query. Fortunately, you can use the RequestID GUID column in the trace to correlate QueryBegin with QueryEnd to look up the username from the QueryBegin row and to add it to the QueryEnd event.