Atlanta MS BI and Power BI Group Meeting on January 9th (Integrating Azure Synapse Analytics and Power BI)

The Atlanta MS BI and Power BI Group is resuming in-person meetings! Please join us for the next meeting on Monday, January 9th, at 6:30 PM ET.  Elayne Jones (Data Engineer at 3Cloud) will show you how to integrate Synapse with Power BI. For more details and sign up, visit our group page.

WE ARE RESUMING IN-PERSON MEETINGS AT THE MICROSOFT OFFICE IN ALPHARETTA. WE STRONGLY ENCOURAGE YOU TO ATTEND THE EVENT IN PERSON FOR BEST EXPERIENCE. PLEASE NOTE THAT GUESTS ENTERING MICROSOFT BUILDINGS IN THE U.S. MUST PROVIDE PROOF OF VACCINATION OR SELF-ATTEST WITH HEALTHCHECK (HTTPS://AKA.MS/HEALTHCHECK). ALTERNATIVELY, YOU CAN JOIN OUR MEETINGS ONLINE VIA MS TEAMS. WHEN POSSIBLE, WE WILL RECORD THE MEETINGS AND MAKE RECORDINGS AVAILABLE AT HTTPS://BIT.LY/ATLANTABIRECS. PLEASE RSVP ONLY IF COMING TO OUR IN-PERSON MEETING.

Presentation: Integrating Azure Synapse Analytics and Power BI

Date: January 9th

Time: 6:30 – 8:30 PM ET

Place: Onsite and online


ONSITE

Microsoft Office (Alpharetta)

8000 Avalon Boulevard Suite 900

Alpharetta, GA 30009

ONLINE

Click here to join the meeting


Overview: Combining the forces of Azure Synapse Analytics and Microsoft Power BI allows you to weave together the full lifecycle of data ingestion, transformation, and visualization. Synapse encompasses the traditional processes of data warehousing, cleansing, and visualizing all within Synapse Studio, fostering unity among teams and driving efficiency across organizations.

Speaker: Elayne Jones is a Data Engineer at 3Cloud. She specializes in data visualization and data modeling using Power BI. She has expertise developing Power Apps and creating Power Platform solutions that drive efficiency within organizations. Elayne is also experienced querying data using the DAX and SQL languages. Elayne has delivered numerous BI trainings and written blog posts on various BI and reporting topics.

PowerBILogo

Report-enable Internal Portals with Power BI Reports

Expanding on my previous blog on this subject, there are three options to report-enable your Intranet portals with Power BI reports:

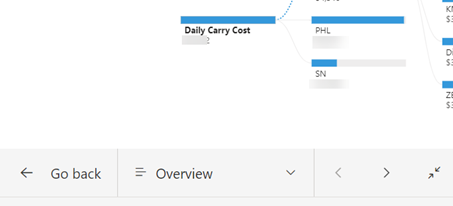
  • Report link – This is the link to the report that you obtain from the browser address bar. If you want to report in full screen viewing mode (hiding the Power BI chrome), you can append the chromeless=1 query parameter to the URL, such as https://app.powerbi.com/groups/689c8ae3-0e22-44d1-9803-b6afdba4e583/reports/b60eaab4-9a85-47c3-8cde-e3a17e8f3dae/ReportSection?chromeless=1. If the “Display report pages as tabs along the bottom of the report” report setting is disabled, the report will be rendered with a few buttons at the bottom. Clicking “Go back” or exiting the full-screen view, will “restore” the Power BI portal chrome, allowing the user to gain access to the report action bar, such as to get report insights. This is the only option to have access to all commands in the report action bar. In addition, the users can store the link in the browser favorites and potentially customize it. However, a report link doesn’t allow the report to be “embedded” in a page. Attempting to put the link on an iframe won’t work because of content security policy (specifically Microsoft sets the Content-Security-Policy tag to frame-ancestors ‘self’ in the response payload, I guess to prevent organizations from circumventing the Power BI portal).
  • Embed for Website or Portal – This is the iframe code you get from the report’s File -> Embed for Website or Portal. This is your easiest option to provide an embedded experience for your coworkers, but it doesn’t currently support the report action bar. There isn’t a way to customize the report link.
  • Power BI Embedded REST API – This option includes server-side and client-side APIs to let you customize the embedding experience, such as to replace the default Filter pane with your own implementation. This is the option most organizations take to provide embedded experience for external customers, but it could be used if you want full control over embedding reports internally. Microsoft added recently an option to show the action bar, however, only a subset of commands are available. This is the only option for single sign-on (SSO) experience, but it’s the most difficult to implement, as it requires extending your app with custom code.

This table summarizes the three options discussed in this blog.

FeatureReport linkEmbed for Website or PortalPower BI Embedded REST API
Embedded content experienceNoYesYes
Single sign-onNoNoYes
Action barNoNoPartially
ShortcutYesNoNo
Developer APINoNoYes
Integration effortLowLowMedium to High

Prologika Newsletter Winter 2022

A few days ago an exalted customer shared that they’ve acquired Synapse and now they’re ready for Power BI modeling. He just wasn’t sure how to give business users access to Synapse so cool self-service BI can finally start. In the process of the conversation, it became clear that he opened Synapse Studio and was left with the impression that Synapse has semantic modeling features. This is what happens when Marketing gets involved and people get confused about what a tool actually does. This newsletter attempts to clear up this confusion.

What’s Synapse?

Think of Synapse (aka Azure Synapse Analytics) as a marketing name that spans multiple unrelated (or rather loosely) related services that are sold separately but are bundled together to fulfill a vision of a “unified analytical platform”. This vision is further emphasized by Synapse Studio – an online tool to work with and monitor the Synapse services.

Like a red giant star, Synapse seems to engulf everything in its path.

Let’s explain each service in the order it’s listed in the Azure pricing calculator. Again, each service has its own pricing model, and the “bundle” doesn’t give you any price break.

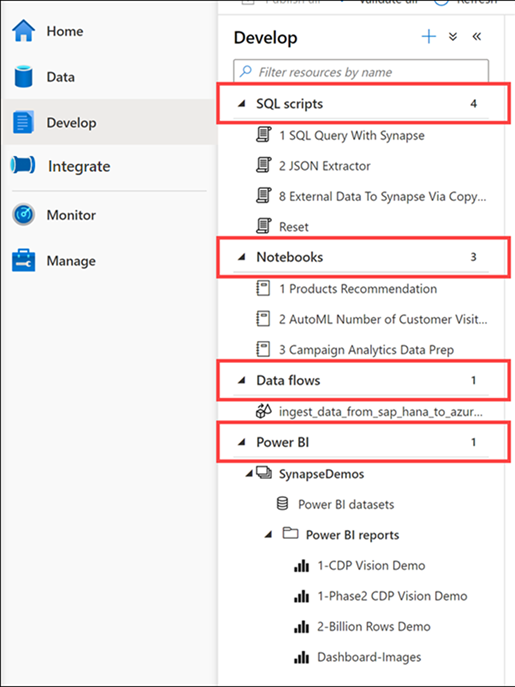
  • Data Integration – This is Azure Data Factory, which is typically acquired and installed as a standalone service. Why would you want to create ADF pipelines inside Synapse Studio instead of ADF Studio is beyond me. Another caveat to watch for regarding data integration is that Microsoft seemingly emphasizes the role of ADF data flows (at least there is a separate “Data flows” section in Synapse Studio) despite that the ELT pattern is a best practice to load data into the SQL dedicated pool.
  • Data Warehousing – Synapse comes with a preconfigured “serverless” pool that can be used to virtualize data stored in Azure Data Lake. This is a very useful service that allows you to query data in ADLS files using T-SQL. Check this case study to learn how Prologika used this feature in a real-life project. This tab also provides pricing for a dedicated SQL pool but since there is a separate tab for it, I’ll cover it further down.
  • Big Data Analytics – You can optionally provision an Azure Spark pool to process data or apply ML at scale using the Microsoft implementation of Apache Spark.
  • Log and Telemetry Analysis – A recently introduced type of pool for analyzing large volumes of data streaming (i.e. log and telemetry data) from applications, websites, or IoT devices using Kusto Query Language (KDL).
  • Dedicated SQL Pool – This is your SQL Server (or rather Azure SQL Database) on steroids for storing and querying massive data volumes that was previously known as Azure SQL DW. While you gain scalability, you lose various T-SQL features so don’t think that you can seamlessly migrate your on-prem SQL databases to Synapse. Also, for now, a dedicated pool is limited only to a single database.
  • Azure Synapse Link – Another recently introduced service to automatically synchronize data from Azure Cosmos DB and SQL Server 2022 (without using change data capture).

What Synapse is not?

Despite that Synapse Studio might trick you otherwise, Synapse is not:

  • Synapse is not a semantic modeling tool. Although you’ll see a Power BI section in the Develop tab of Synapse Studio, modeling is still done with Power BI Desktop (or other professional tools) and published to Power BI. As with ADF, why would a developer want to register your Power BI artifacts in Synapse Studio is another thing that escapes me.
  • Synapse is not a data integration tool, master data management tool, or data cataloging tool.
  • Synapse shouldn’t be your default option for data warehousing in the cloud. In my experience, Synapse would be an overkill for data processing needs of most companies because there are more cost-effective options for SQL Server in the cloud with less data.


Teo Lachev
Prologika, LLC | Making Sense of Data
logo

What Exactly is Microsoft Synapse?

The other day an exalted customer shared that they’ve acquired Synapse and now they’re ready for implementing semantic models with Power BI. The client wasn’t sure how to give business users access to Synapse so cool self-service BI can finally start. In the process of the conversation, it became clear that they opened Synapse Studio and were left with the impression that Synapse has semantic modeling features. This is what happens when Marketing gets involved and people get confused about what a tool actually does. Let’s attempt to clear this confusion.

What’s Synapse?

Think of Synapse (aka Azure Synapse Analytics) as a umbrella name that spans multiple unrelated (or rather loosely) related services that are sold separately but are bundled together to fulfill a vision of a “unified analytical platform”. This vision is further emphasized by Synapse Studio – an online tool to work with and monitor the Synapse services.

Let’s explain each service in the order it’s listed in the Azure pricing calculator. Again, each service has its own pricing model, and I don’t think that bundling them together gives you any price break.

  • Data Integration – This is Azure Data Factory, which is typically acquired and installed as a standalone service. Why would you want to create ADF pipelines inside Synapse Studio instead of ADF Studio is beyond me. Another caveat to watch for regarding data integration is that Microsoft seemingly emphasizes the role of ADF data flows (at least there is a separate “Data flows” section in Synapse Studio) despite that the ELT pattern is a best practice to load data into the SQL dedicated pool.
  • Data Warehousing – Synapse comes with a preconfigured “serverless” pool that can be used to virtualize data stored in Azure Data Lake. This is a very useful service that allows you to query data in ADLS files using T-SQL. Check this case study to learn how Prologika used this feature in a real-life project. This tab also provides pricing for a dedicated SQL pool but since there is a separate tab for it, I’ll cover it further down.
  • Big Data Analytics – You can optionally provision an Azure Spark pool to process data or apply ML at scale using the Microsoft implementation of Apache Spark.
  • Log and Telemetry Analysis – A recently introduced type of pool for analyzing large volumes of data streaming (i.e. log and telemetry data) from applications, websites, or IoT devices using Kusto Query Language (KDL).
  • Dedicated SQL Pool – This is your SQL Server (or rather Azure SQL Database) on steroids for storing and querying massive data volumes that was previously known as Azure SQL DW. While you gain scalability, you lose various T-SQL features so don’t think that you can seamlessly migrate your on-prem SQL databases to Synapse. Also, for now, a dedicated pool is limited only to a single database.
  • Azure Synapse Link – Another recently introduced service to automatically synchronize data from Azure Cosmos DB and SQL Server 2022 (without using change data capture).

What Synapse is not?

  • Synapse is not a semantic modeling tool. Although you’ll see a Power BI section in the Develop tab of Synapse Studio, modeling is still done with Power BI Desktop (or other professional tools) and published to Power BI. As with ADF, why would a developer want to register your Power BI artifacts in Synapse Studio is another thing that escapes me.
  • Synapse is not a data integration tool, master data management tool, or data cataloging tool.
  • Synapse shouldn’t be your default option for data warehousing in the cloud. In my experience, Synapse would be an overkill for data processing needs of most companies because there are more cost-effective options for SQL Server in the cloud with less data.

Testing DAX Measures

DAX can get complex and humble even experienced BI developers. Since Microsoft left us without a proper debugger, here a couple of techniques that I use to debug DAX when going gets tough:

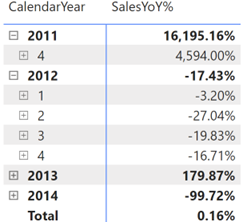
  1. Variables – I often break down the formula in variables. As a bonus, variables make expressions easier to read and might yield performance gains. Consider the following SalesYoY% measure that calculates the variance in sales between the current period and same period last year.
    SalesYoY% =
    VAR _LastYearSales =
    CALCULATE (
    [InternetSales],
    SAMEPERIODLASTYEAR ( 'Date'[Date] )
    )
    RETURN
    IF (NOT ISBLANK([InternetSales]), DIVIDE ([InternetSales] - _LastYearSales, _LastYearSales))

    Let’s say you believe that last year’s sales look suspicious, such as the high value for 2011. You can comment the last line and return the LastYearSales variable to investigate further.

    SalesYoY% =
    VAR _LastYearSales =
    CALCULATE (
    [InternetSales],
    SAMEPERIODLASTYEAR ( 'Date'[Date] )
    )
    RETURN
    _LastYearSales
    --IF (NOT ISBLANK([InternetSales]), DIVIDE ([InternetSales] - _LastYearSales, _LastYearSales))
  2. The EvaluateAndLog function – With the introduction of the EvaluateAndLog function in Power BI, Microsoft has provided us with a poor man’s debugger that can print the output of a DAX expression. For example, to investigate the last year’s sales, you can enclose it with EvaluateAndLog.
    SalesYoY% =
    VAR _LastYearSales =
    CALCULATE (
    [InternetSales],
    SAMEPERIODLASTYEAR ( 'Date'[Date] )
    )
    RETURN
    IF (NOT ISBLANK([InternetSales]), DIVIDE ([InternetSales] – EvaluateAndLog(_LastYearSales), _LastYearSales))

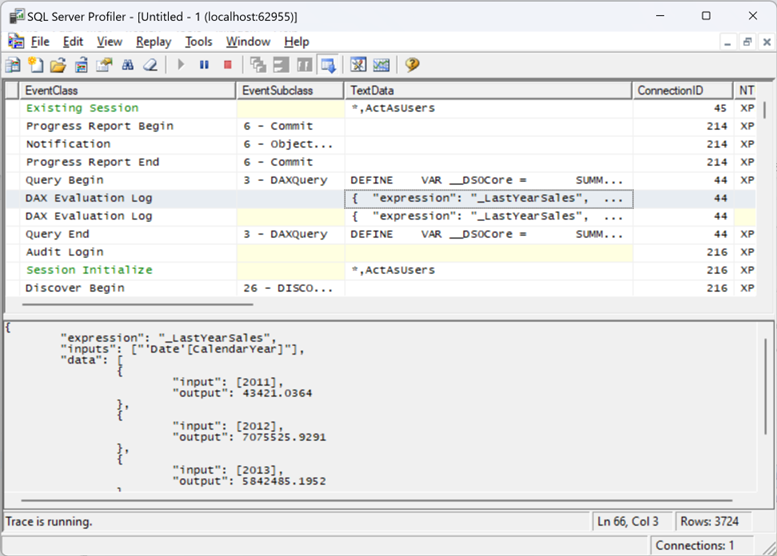
    Then, you can use the SQL Server Profiler (distributed with SSMS) or the tool mentioned in the blog to see the output. I have the SQL Server Profiler registered as a Power BI Desktop external tool using the steps in this blog so that I can conviniently launch it connected to the Power BI Desktop model. Once the profiler opens, make sure to select the “DAX Evaluation Log” event.

    In this case, the event outputs the last year’s sales broken by year because the visual slices the measure by years.

Atlanta MS BI and Power BI Group Meeting on December 5th (Automate and Improve Planning, Budgeting and Forecasting)

The Atlanta MS BI and Power BI Group is resuming in-person meetings! Please join us for the next meeting on Monday, December 5th, at 6:30 PM ET.  Your humble correspondent will show you how to implement a custom solution for automating planning, budgeting, and forecasting based on a real-life project. For more details and sign up, visit our group page.

WE ARE RESUMING IN-PERSON MEETINGS STARTING DECEMBER 5, 2022, AT THE MICROSOFT OFFICE IN ALPHARETTA. WE STRONGLY ENCOURAGE YOU TO ATTEND THE EVENT IN PERSON FOR BEST EXPERIENCE. PLEASE NOTE THAT GUESTS ENTERING MICROSOFT BUILDINGS IN THE U.S. MUST PROVIDE PROOF OF VACCINATION OR SELF-ATTEST WITH HEALTHCHECK (HTTPS://AKA.MS/HEALTHCHECK). ALTERNATIVELY, YOU CAN JOIN OUR MEETINGS ONLINE VIA MS TEAMS. WHEN POSSIBLE, WE WILL RECORD THE MEETINGS AND MAKE RECORDINGS AVAILABLE AT HTTPS://BIT.LY/ATLANTABIRECS. PLEASE RSVP ONLY IF COMING TO OUR IN-PERSON MEETING.

Presentation: Automate and Improve Budgeting, Planning, and Forecasting

Date: December 5th

Time: 6:30 – 8:30 PM ET

Place: Onsite and online


ONSITE

Microsoft Office (Alpharetta)

8000 Avalon Boulevard Suite 900

Alpharetta, GA 30009

ONLINE

Click here to join the meeting

Overview: Business Performance Management (BPM) is a methodology to help the company predict its performance. An integral part of a BPM strategy is a process for Budgeting, Planning, and Forecasting which is typically performed by the Finance department. When it comes to Finance, nothing is simple, and budgeting is no exception.  The temptation is to buy expensive prepackaged software but even that route would require a lot of customization and compromises.

Join this session to learn how to implement your own home-grown solution using Microsoft Analysis Services and Excel. I’ll share lessons learned from a real-life project.

Speaker: Teo Lachev is a consultant, author, and mentor, with a focus on Microsoft BI. Through his Atlanta-based company Prologika he designs and implements innovative solutions that bring tremendous value to his clients. Teo has authored and co-authored several books, and he has been leading the Atlanta Microsoft Business Intelligence group since he founded it in 2010. Microsoft has recognized Teo’s contributions to the community by awarding him the prestigious Microsoft Most Valuable Professional (MVP) Data Platform status for 15 years. Microsoft has selected Teo as one of only 30 FastTrack Solution Architects for Power BI worldwide.

Sponsor: Prologika (a Microsoft Gold Partner in Data Analytics and Data Platform and Power BI Red Carpet Partner) helps organizations of all sizes to make sense of data. Your BI project will be your best investment, we guarantee it! prologika.com

Prototypes with Pizza: Power BI latest news

Download presentation

PowerBILogo

Estimating DAX Query Completion Time

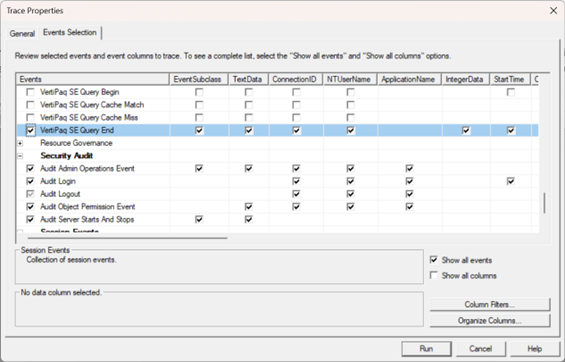
Usually, DAX queries execute very fast, like flashes in a gold seeker’s pan. Sometimes, however, you could end up with a massive DAX query that takes minutes if not hours. For example, a financial institution requested credit monitoring results to be evaluated overnight and saved in a relational database for fast retrieval. The query involved processing some 300+ measures for 40 million customers and took about an hour to complete. While working on optimizing the query and tracing its execution, I enabled the VertiPaq SE Query End event and was able to monitor how far the query got by seeing which measure is being processed. This was also useful to understand which measures are more expensive.

In general, the server doesn’t process measures in parallel. A measure may produce multiple storage queries, some in parallel and some sequentially. The VertiPaq SE Query End event would show the SQL-like query that the server sent to the storage engine, but usually you can easily correlate it to the DAX formula of the measure being processed. Thanks to the performance enhancements Microsoft is making, such as horizontal fusion, multiple measures may be coalesced into the same storage operation, and therefore a query with multiple measures might yield parallelism or could be sequential. On the other hand, there is plenty of parallelism within a Vertipaq query.

Atlanta MS BI and Power BI Group Meeting on November 7th (Data Science for Power BI Developers)

Please join us online for the next Atlanta MS BI and Power BI Group meeting on Monday, November 7th, at 6:30 PM ET.  Sandeep Pawar will join us again to show us the Power BI data science features and how you can create ML models. For more details and sign up, visit our group page.

Presentation:Data Science for Power BI Developers
Date:November 7th
Time:6:30 – 8:30 PM ET
Place:Click here to join the meeting
Overview:The use of Data Science tools and techniques has grown in the last few years and BI developers are collaborating closely with the Data Scientists. In this session, we will learn about some of the core concepts in data science, key terminologies and the overall process so that you as a BI developer can effectively collaborate with your Data Science team. You will learn about analogous features in Power BI, their pitfalls, the overall Machine Learning process and the questions you should be asking the next time you are consuming the ML model in Power BI.


This session won’t teach you how to create Machine Learning models, rather it will show you how you should consume the Machine Learning models as a BI developer to help your business users.

Speaker:Sandeep Pawar is a Sr. Power BI Architect at Hitachi Solutions America. He has extensive experience in creating data analytics and data science solutions. You can read more about him and his passion for data at www.pawarbi.com or follow him on twitter at @PawarBI.
Prototypes without PizzaPower BI Latest

PowerBILogo

Testing RLS with Power BI Shared Datasets

In a typical engagement, I create an organizational semantic model(s) and “report packs”, such as Sales Report Pack, Inventory Report Pack, etc. These report packs are typically implemented as Power BI reports connected to the semantic model as a shared dataset using the Power BI Datasets connector. Reports sanctioned by IT are published to a dedicated workspace, such as Corporate BI. Departmental reports are deployed to their respective workspace, such as Sales, to enforce content-level security. Usually, the semantic model has row-level security (RLS) roles defined to enforce restricted access to data depending on the identity of the interactive user.

Although not immediately obvious, here is how you can test RLS to ensure that connected reports produce expected results under someone else’s identity directly in Power BI Service:

  1. In powerbi.com, go to the workspace where the shared dataset is published.
  2. In the dataset page, click the Datasets tab, and then click the ellipsis button (…) next to the shared dataset. In the dataset Settings, click Security.
  3. Expand the … button next to the Restricted Access role, and then click “Test as role”. This will open whatever report is included in the shared dataset pbix file (I typically have some reports there for testing).
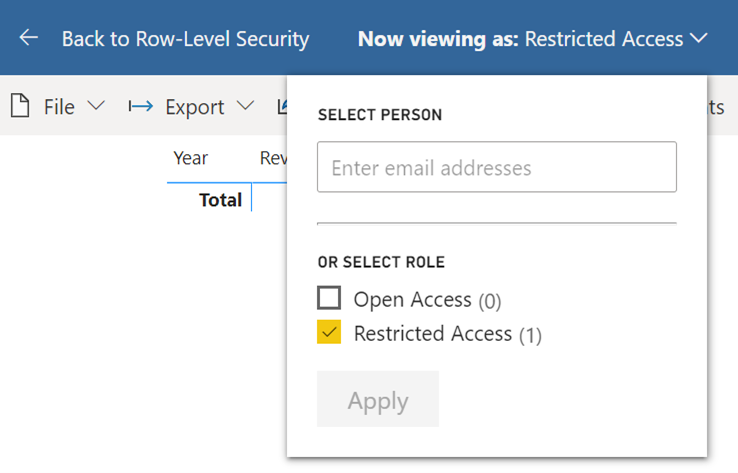
  4. You can expand the Restricted Access dropdown and enter the user email of the user whose RLS permissions you want to test or the role you want to apply. In the screenshot below, I’m testing under my identity applying the rules in the Restricted Access role. If I wanted to test what a specific user would see, I’d type in that user’s email.
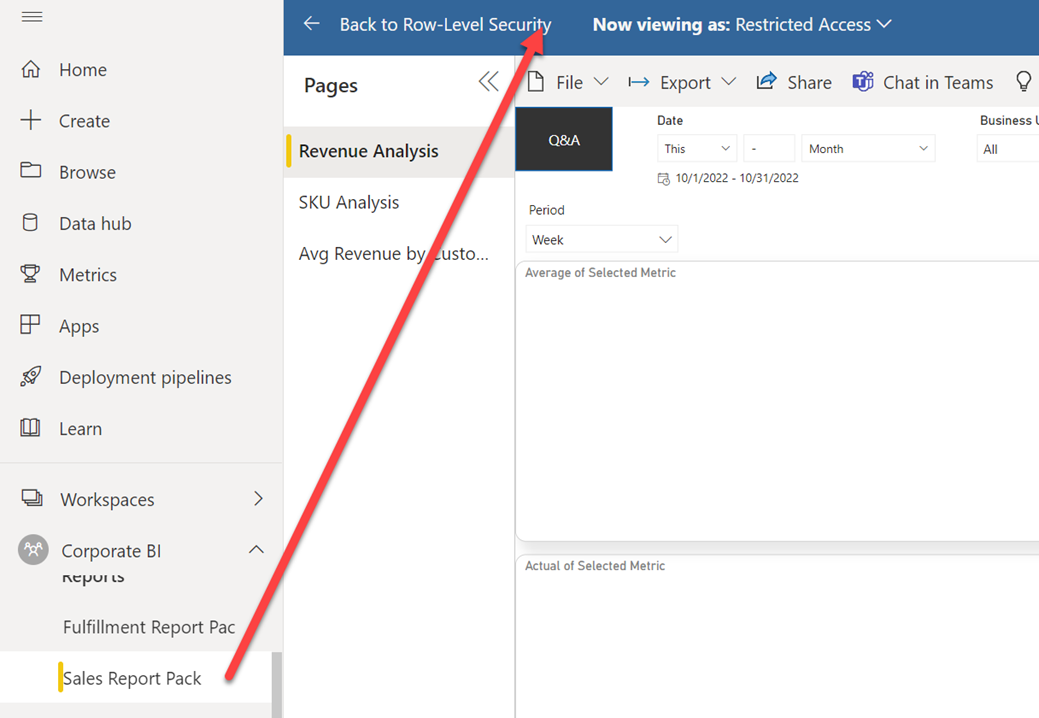
  5. To test other reports for this user, expand the powerbi.com left-navigation pane and then click the desired report. Power BI will navigate you to that report, but it will honor RLS.

Correlating Analysis Services Errors with Measures

This blog builds upon my previous “Resolving Tabular Conversion Errors” and applies to Analysis Services in all flavors (Power BI, MD, and Tabular). In the scenario I described in the previous blog, the server at least told us the name of the offending measure in the error description. But sometimes you might not be that lucky. For example, recently I got this error when running a DAX query requesting many measures: “Microsoft OLE DB Provider for Analysis Services.” Hresult: 0x80004005 Description: “MdxScript(Model) (2000, 133) Failed to resolve name ‘SYNTAXERROR’. It is not a valid table, variable, or function name.” All we know is that there is a syntax error in some measure but good luck finding it if you have hundreds of measures in the query and your model. However, the (2000,133) section references the line number and column number in the MDX script (Yeap, MDX even if you use Tabular), so if we can get the script, we might be able to correlate the error.

Getting that script is elusive as the only way I know off for Tabular models is to trace the “Execute MDX Script Begin” or “Execute MDX Script End” events. But these events are generated only the first time a user with a given set of role permissions connects to a cube after processing, clearing the cache, or restarting the server. So, after you connect the SQL Server Profiler to the cube and check either of these two events (you must click Show All Events because the events are not shown by default), you can execute Clear Cache or process a table. Then, connect to the cube and execute any MDX or DAX query. In the Profiler, locate the “Execute MDX Script Begin” event. The payload should start with CALCULATE followed by all measure definitions.

CALCULATE;
CREATE MEMBER CURRENTCUBE.Measures.[__Default measure] AS 1; ALTER CUBE CURRENTCUBE UPDATE DIMENSION Measures, Default_Member = [__Default measure];
CREATE
MEASURE'Date'[Days Current Quarter to Date]=COUNTROWS( DATESQTD( 'Date'[Date]))
MEASURE'Date'[Days in Current Quarter]=COUNTROWS( DATESBETWEEN( 'Date'[Date], STARTOFQUARTER( LASTDATE('Date'[Date])), ENDOFQUARTER('Date'[Date])))
MEASURE'Internet Sales'[Internet Distinct Count Sales Order]=DISTINCTCOUNT([Sales Order Number])
….

Copy that payload and paste it in an editor that has line numbers, such as Notepad++. Then go to the line number (you can press Ctrl+G in Notepad) mentioned in the error description.

Using this technique, I was able to narrow down the measure and discovered that I’ve missed a comma in the DIVIDE DAX function. I’ve made the change in the Tabular Editor, but it didn’t catch the syntax error.