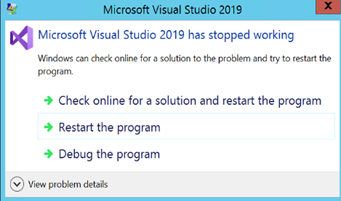
I’ve spent hours on this so someone else might find the solution useful. I’ve developed an SSIS package that uses a ForEach Loop container. Then, I closed Visual Studio and reopen it. The SSIS designer opens the package, thinks for a few seconds if it likes it or not, and then it crashes Visual Studio. I’ve noticed that the VS status bar shows a message that it validates the ForEach Loop container, which was an important clue.
How do we fix this horrible issue? Initially, I was thinking that it was interference from Visual Studio 2022 that someone else has recently installed. So, I upgraded, uninstalled, repaired, tried VS 2022, etc. to no avail.
Finally, I open the package code in text editor and added “DTS:DelayValidation=”True” to the container task to disable the upfront validation on package open.
This fixed the issue although I had no idea what caused the crash.
Please join us for the next meeting on Monday, April 3rd, at 6:30 PM ET. Your humble correspondent will revisit Power BI important fundamentals in a demo-packed session. For more details and sign up, visit our group page.
PLEASE NOTE THAT OUR IN-PERSON MEETING LOCATION HAS CHANGED! WE STRONGLY ENCOURAGE YOU TO ATTEND THE EVENT IN PERSON FOR BEST EXPERIENCE. ALTERNATIVELY, YOU CAN JOIN OUR MEETINGS ONLINE VIA MS TEAMS. WHEN POSSIBLE, WE WILL RECORD THE MEETINGS AND MAKE RECORDINGS AVAILABLE AT HTTPS://BIT.LY/ATLANTABIRECS. PLEASE RSVP ONLY IF COMING TO OUR IN-PERSON MEETING.
Presentation: Power BI Dashboard in an Hour (DIAH)
Date: April 3rd
Time: 18:30 – 20:30 ET
Place: Onsite and online
Level: Beginner
Food: Food and drinks will be available for this meeting
Agenda:
18:15-18:30 Registration and networking
18:30-19:00 Organizer and sponsor time (events, Power BI latest, sponsor marketing)
Targeting novice Power BI users, this hands-on, no-slide session covers important Power BI fundamentals and best practices. If you’re already a Power BI user, you’ll probably learn a new trick or two. And if you like a challenge, bring your laptop and try to keep up through the steps to create a Power BI dashboard!
Join us and learn how to:
Design your BI model
Acquire and transform data
Turning data into valuable and interactive insights
Sharing your visualizations with others
Speaker: Teo Lachev is a consultant, author, and mentor, with a focus on Microsoft BI. Through his Atlanta-based company Prologika he designs and implements innovative solutions that bring tremendous value to his clients. Teo has authored and co-authored several books, and he has been leading the Atlanta Microsoft Business Intelligence group since he founded it in 2010. Microsoft has recognized Teo’s contributions to the community by awarding him the prestigious Microsoft Most Valuable Professional (MVP) Data Platform status for 15 years. Microsoft selected Teo as one of only 30 FastTrack Solution Architects for Power BI worldwide.
Sponsor: Improving
Prototypes with Pizza: Power BI Latest with Teo Lachev
https://prologika.com/wp-content/uploads/2016/01/logo.png00Prologika - Teo Lachevhttps://prologika.com/wp-content/uploads/2016/01/logo.pngPrologika - Teo Lachev2023-03-28 13:40:512023-03-28 13:41:45Atlanta MS BI and Power BI Group Meeting on April 3rd (Power BI Dashboard in an Hour)
Warning: This blog contains old tricks of an old dog.
Scenario: Suppose you have a large table in SQL Server, e.g. hundreds of millions or even a billion rows. DML operations (SELECT, INSERT, UPDATE, DELETE) take long time. How do you speed them up? Do you split the large table into multiple tables? Or, do you ask for better hardware? Or, do you start looking for a new job with less data?
Solution: It’s nothing new but I see clients struggle with this all the time because they don’t know any better.
The solution is to partition the table and use partition switching that SQL Server has supported since time immemorial.
Cathrine Wilhelmsen has a great step-by-step blog covering different scenarios, but the process goes like this:
Configure page compression for the large table (see benefits here).
Partition the large table, such as by month.
Create a not-partitioned staging table that has the same indexes and compression as the large table.
Find the corresponding partition in the large table that will require DML, such as by using this script.
If the data requires updates, switch out the affected partition to the staging table. Perform updates. For full loads where rows will be only inserted, you don’t have to switch out the partition (see the second scenario in Cathrine’s blog).
Switch in the staging table into the corresponding partition of the large table. This should take a few seconds.
As a bonus, the SQL Server query processor could eliminate partitions for SELECTs, thus improving the query performance.
https://prologika.com/wp-content/uploads/2016/01/logo.png00Prologika - Teo Lachevhttps://prologika.com/wp-content/uploads/2016/01/logo.pngPrologika - Teo Lachev2023-03-24 12:23:162023-03-24 12:23:16Working with Large Tables in SQL Server
Please join us for the next meeting on Monday, March 6th, at 6:30 PM ET. Leo Furlong (Senior Solutions Architect at Databricks) will share their point of view on why “the best data warehouse is a lakehouse.” For more details and sign up, visit our group page.
PLEASE NOTE THAT OUR IN-PERSON MEETING LOCATION HAS CHANGED! WE STRONGLY ENCOURAGE YOU TO ATTEND THE EVENT IN PERSON FOR BEST EXPERIENCE. ALTERNATIVELY, YOU CAN JOIN OUR MEETINGS ONLINE VIA MS TEAMS. WHEN POSSIBLE, WE WILL RECORD THE MEETINGS AND MAKE RECORDINGS AVAILABLE AT HTTPS://BIT.LY/ATLANTABIRECS. PLEASE RSVP ONLY IF COMING TO OUR IN-PERSON MEETING.
Presentation: The Semantic Lakehouse: Power BI and Databricks
Date: March 6th
Time: 18:30 – 20:30 ET
Place: Onsite and online
Level: Intermediate
Food: Food and drinks will be available for this meeting
Agenda:
18:15-18:30 Registration and networking
18:30-19:00 Organizer and sponsor time (events, Power BI latest, sponsor marketing)
Overview: The team from Databricks will come and share their point of view on why “the best data warehouse is a lakehouse.” We’ll go over lakehouse 101, when you might (or might not!) need a lakehouse, some best practices for operating a BI solution with Databricks, and walk through a demo highlighting how PowerBI’s and Databricks’ SQL capabilities complement each other.
Speaker: Leo Furlong, Senior Solutions Architect at Databricks Leo is a seasoned data and analytics professional with 15 years of consulting experience building Data Warehousing and BI solutions using SQL Server, Power BI, and Azure technologies prior to joining Databricks in 2021. As an Atlanta native, Leo is a Georgia Tech and Georgia State grad and lives in the Smyrna/Vinings area with his 4 kids and 4 dogs.
Sponsor: Databricks
Prototypes with Pizza: Power BI Latest with Teo Lachev
https://prologika.com/wp-content/uploads/2016/01/logo.png00Prologika - Teo Lachevhttps://prologika.com/wp-content/uploads/2016/01/logo.pngPrologika - Teo Lachev2023-03-03 15:37:022023-03-03 15:37:02Atlanta MS BI and Power BI Group Meeting on March 6th (The Semantic Lakehouse: Power BI and Databricks)
I’m presenting at SQL Saturday Atlanta 2023 – BI & Data Analytics Edition on February 25th at 9 AM (the very first slot in the very first room for very first early birds). I’ll do a Power BI Dashboard in an Hour this time to revisit the basics. I hope to see some of you there.
Targeting novice Power BI users, this hands-on, no-slide session covers important Power BI fundamentals and best practices. If you’re already a Power BI user, you’ll probably learn a new trick or two. And if you like a challenge, bring your laptop and try to keep up through the steps to create a Power BI dashboard! Join us and learn how to:
• Design your BI model
• Acquire and transform data
• Turning data into valuable and interactive insights
Microsoft announced a public preview of Power BI Dataset scale-out (DSO) for Power Premium, Premium per User (PPU), and Power BI Embedded. In the comments below the announcement, the article implies that this feature is a replacement for the Azure Analysis Services scale-out. “If you have an AAS scale out and you migrate your databases (aka models aka datasets aka cubes) to Power BI Premium, you get scale out automatically and at no extra cost.” Scaling out for free? Sure, where do I sign?
But then further down the comments, we have this clarification “[Power BI DSO happens] if a dataset is on peak load and the vcores of your capacity aren’t maxed out. Keep in mind that scalability on a single instance isn’t linear. By scaling out, we can achieve a better utilization of available CPU resources for high workloads. On the other hand, if your vcores are already maxed out, then scaling out brings no further perf benefit.” Confused? So was I, and I reached for clarification to Microsoft. Below, is my best understanding of what happens behind the scenes.
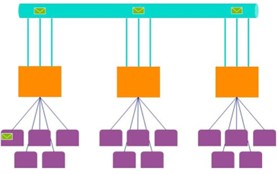
First, let’s start with a definition. By scaling out, we mean distributing the load to more machines (presumably when scaling up has saturated one server). AAS scale-out is a true scale-out because you provision additional VMs (replicas) and the system distributes queries across the available replica to achieve a linear load (to the point of saturation of course). The big downside is that you pay for each replica and that cost can surely a dent in your budget (a customer recently incurred 30K for one month with the maximum 7 replicas).
Power BI DSO gets trickier. First, Power BI monitors your overall CPU usage to make sure that you don’t abuse the system and exceed the provisioned number of cores. For example, P1 limits you to 4 background cores. If your capacity is consistently saturated, DSO doesn’t bring any benefits. Power BI will throttle all replicas if it sees sustained saturation. You paid for 4 cores and you get 4 cores overall, irrespective that you now have other read replica(s).
But then, suppose the system is in a relatively quiet state. Suddenly, at 8 AM in the morning, a burst of queries comes along from sales reps checking the latest commissions. Now, Power BI will distribute these queries across the replicas to answer them as quickly as possible without throttling. But there is also some smoothing that happens as your queries execute in Gen2. If you get 100 queries at the same time, then they can all execute together with no throttling and on different replicas. After they finish, their CPU cost may cause latency for the next set of queries – but if there’s enough of a gap between this burst of queries and the next burst of queries, then the impact will be minimal and you would just see far better experiences for the end users.
Additional performance boost can be realized by enabling Power BI core auto-scale. As your CPU usage grows beyond the provisioned cores, Power BI will provision more cores. And now you will benefit from a second replica, because a new VM is available with its own set of physical cores. By contrast, without QSO the extra cores wouldn’t really help performance of that dataset because the first replica is running on a VM with all provisioned cores.
For now, DSO targes refresh isolation (one write + one read replica) and this enables scenarios where you want to do a full refresh on a large dataset that wouldn’t otherwise fit in memory. But in future, Power BI promises DSO to scale out to more read replicas. However, I see no reason against using this feature for large datasets, such as organizational semantic models, even in its current state (free, remember?).
Finally, unlike AAS, replica synchronization is automatic if you schedule the dataset refresh in Power BI. If you go through the back door, such as to process a dataset via the XMLA endpoint, you’re on your own synchronizing the replicas.
The following table summarizes the DSO features for AAS and Power BI.
Azure Analysis Services
Power BI
Core throttling
No
Yes, with sustained loads
Primary scenario
Better query performance
Currently, refresh isolation
Synchronization
Explicit synchronization required
Automatic (Power BI dataset refresh) or explicit when XMLA endpoint is used
Cost
Pay per replica
No additional cost
https://prologika.com/wp-content/uploads/2016/01/logo.png00Prologika - Teo Lachevhttps://prologika.com/wp-content/uploads/2016/01/logo.pngPrologika - Teo Lachev2023-02-15 15:19:052023-02-15 15:43:16Demystifying Power BI Dataset Scale-out
There has been a lot of noise surrounding a data lakehouse nowadays, so I felt the urge to chime in. In fact, the famous guy in cube, Patrick LeBlanc, gave a great presentation on this subject to our Atlanta Power BI Group and you can find the recording here (I have to admit we could have done better job with the recording quality, but we are still learning in the post-COVID era).
What is a Lakehouse?
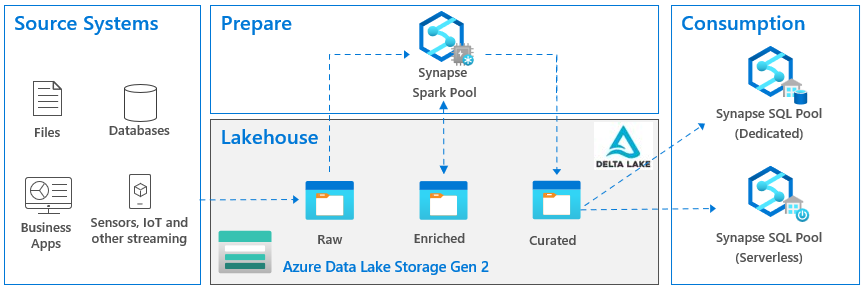
According to Databricks which are credited with this term, a data lakehouse is “a new, open data management architecture that combines the flexibility, cost-efficiency, and scale of data lakes with the data management and ACID transactions of data warehouses, enabling business intelligence (BI) and machine learning (ML) on all data.” It other words, it’s a hybrid between a relational data warehouse and a data lake. Sounds great, right? Visualizing this in Microsoft parlor, the last incarnation of the lakehouse architecture that I came across looks like this:
The Good
I’m sure that many large companies or companies with complex data integration needs could benefit from a similar architecture. As I said many times, staging data to a lake is a good thing when you must deal with files. For example, some cloud vendor that hasn’t matured enough to give direct access to your data, could decide to push files instead (I described a similar scenario in this blog). A “network share” on steroids, the data lake is the best place to store files. A good question here and the one I personally struggled with would be “what if the data comes from relational databases or from REST APIs?” Should you stage that data in a data lake as files before it flows into the data warehouse? A wise consultant’s answer here would be “it depends”. Here are some good reasons when this might make sense.
Stage data first – For some, a large ISV company (see related newsletter here), had to integrate data from many databases with similar but not the same schema. They preferred to stage the data to a data lake and figure out the integration “mess” caused my schema discrepancies and data quality later.
A glorified archive – For example, in case you want to reload the data, you can do it from the lake in the case where the source systems truncate data. However, my personal preference to address this scenario would be to stage the data into a relational Operational Data Store (ODS), especially in the case where changes must be tracked. In a nutshell, if I’m given a choice between a file or relational database, I’d go with the latter.
Synapse – If you decide to host your data warehouse in a Synapse dedicated SQL pool and use Azure Data Factory (ADF) to load the data, ADF will stage the data to Azure Data Lake Service (ADLS) anyway to load it faster into Synapse. Another good thing for Synapse here is that you can use Synapse Serverless to query that data using SQL which might come handy (I share some “serverless” lessons learned here).
Data science – There are some good reasons why data scientists prefer files instead of loading the data from a relational database. Or so I was told (I’m not a data scientist).
Uniformity – If your organization prefers a uniform data flow path despite the additional effort, inconvenience, and redundancy, then this might make sense. Then despite the source data type (structured or unstructured), all data follows the same ingestion pipeline. Just make sure to hire more ETL developers.
Outside these considerations, when you can connect directly to the data source, staging data to files is probably overkill as files are notoriously difficult to deal with.
The Bad
Now let’s look at the so-called zones in the lake: raw, enriched and curated, sometimes also referenced as bronze, silver, and gold. The idea here is to enrich the staged data. So, the raw zone has the staged data 1:1 as in the source. Then let’s say a data scientist needs some enrichment, and we spin more ETL to add a bunch of columns to some file. And then Business needs to reference the data that might require more enrichment. So, into the ETL rabbit hole we go again.
The problem is that many people take this architecture verbatum, whether it makes sense or not. A question came from the audience during Patrick’s presentation “What data do we add to these zones?” How do we know when it’s time to move to the next zone? And the answer here is that these zones are just a recommendation that someone has come up with. A large organization might benefit from them. But in most cases in my opinion spinning more and more ETL and moving data around just so that you follow some vendor’s best practices, makes no sense. And should you stage the data 1:1 from the source? In some cases, like the Get Data First aforementioned scenario, it might make sense. But in most cases, it would be much more efficient to stage the data in the shape you need it, which may necessitate joining multiple tables at the source (by the way, a relational server is the best place to handle joins).
The omni-presence of Synapse in such architectural diagrams is questionable at least. As I stated in another newsletter, like a red giant star, Synapse seems to engulf everything in its path in order to increase its value potential. But Synapse shouldn’t be a default choice for most organizations. It’s rather expensive and has limitations, such as lacking important T-SQL features.
Finally, Spark/Databricks that orchestrates the data preparation with Python or some other custom code since all the toolset you get is a notebook with a blinking cursor. What happened to low code, no code approach? More ETL developers to the rescue…
The Ugly
The omnipresence of the delta lake regardless if it makes sense or not. I’m sure that some scenarios for staging changing data into a lake, such as IoT streaming, will benefit greatly from a delta lake. But it shouldn’t be a default recommendation. The moment we introduce a delta lake, our tool choice becomes rather restricted because of the file format. On ETL side of things, for example, you must use data flows with Azure Data Factory (I’d personally favor ELT over data flows). And to read the data, you must provision either a Spark cluster or Synapse Serverless. So, complexity increases together with cost while data accessibility decreases.
And if you go with Databricks (credited for inventing the delta lake too), they are far more ambitious . They want to replace RDBMs for OLAP (OLTP won’t work with a delta lake for performance reasons). We’ve seen similar claims before and how they ended. Another question came from the audience during the presentation was if a lakehouse can deliver the same performance as a relational database. One house must be redundant, right? True, after rewriting their software, Databricks can deliver some decent performance (they even claim to be the world’s fastest “data warehouse” although only one other vendor submitted results to that specific benchmark). James Serra (Data & AI Solution Architect at Microsoft), whose excellent blog discusses these topics in detail, recently gave our group a presentation and said that anyone he knows of that has tried replacing a relational data warehouse with a data lake, has failed. Enough said.
What’s a best practice? A best practice to me is adopting the most efficient way to achieve something without sacrificing too much flexibility for what might be thrown at you in the future. To me, a lakehouse as a replacement for a relational data warehouse or as a default staging area is as big of a hype as Big Data was, with all the vendor propaganda surrounding it to buy stuff you don’t need. Large organizations with complex integration needs might benefit from the lakehouse architecture shown above. However, most companies could save a lot of implementation, maintenance, and licensing costs by simplifying it and judicially introducing pieces when it makes sense.
https://prologika.com/wp-content/uploads/2016/01/logo.png00Prologika - Teo Lachevhttps://prologika.com/wp-content/uploads/2016/01/logo.pngPrologika - Teo Lachev2023-02-08 17:11:322023-02-13 19:36:53Data Lakehouse: The Good, The Bad, and the Ugly
Please join us for the next meeting on Monday, February 6th, at 6:30 PM ET. Patrick LeBlanc (Principal Program Manager at Microsoft and Guy in a Cube) will show you how to implement a lakehouse with Delta lake, Azure Data Factory, and Synapse. For more details and sign up, visit our group page.
WE ARE RESUMING IN-PERSON MEETINGS AT THE MICROSOFT OFFICE IN ALPHARETTA. WE STRONGLY ENCOURAGE YOU TO ATTEND THE EVENT IN PERSON FOR BEST EXPERIENCE. PLEASE NOTE THAT GUESTS ENTERING MICROSOFT BUILDINGS IN THE U.S. MUST PROVIDE PROOF OF VACCINATION OR SELF-ATTEST WITH HEALTHCHECK (HTTPS://AKA.MS/HEALTHCHECK). ALTERNATIVELY, YOU CAN JOIN OUR MEETINGS ONLINE VIA MS TEAMS. WHEN POSSIBLE, WE WILL RECORD THE MEETINGS AND MAKE RECORDINGS AVAILABLE AT HTTPS://BIT.LY/ATLANTABIRECS. PLEASE RSVP ONLY IF COMING TO OUR IN-PERSON MEETING.
Overview: Join us for an action-packed demo-fueled session where we actually build a lake house from source to report in less than an hour. We will walk you through getting your data from your source system, building out your data lake using Delta, transforming your data with Data Flows, serving it with Serverless SQL Pool and in the end connecting it to Power BI! After this session you will be able to start using all of these technologies and make your Analytical environment a success!
Speaker: Patrick LeBlanc is a currently a Principal Program Manager at Microsoft and a contributing partner to Guy in a Cube. Along with his 15+ years’ experience in IT he holds a Masters of Science degree from Louisiana State University. He is the author and co-author of five SQL Server books. Prior to joining Microsoft he was awarded Microsoft MVP award for his contributions to the community. Patrick is a regular speaker at many SQL Server Conferences and Community events.
Sponsor: The Community (thank you for your donations!)
Prototypes with Pizza: Power BI latest news
https://prologika.com/wp-content/uploads/2016/01/logo.png00Prologika - Teo Lachevhttps://prologika.com/wp-content/uploads/2016/01/logo.pngPrologika - Teo Lachev2023-01-31 11:26:142023-01-31 11:26:14Atlanta MS BI and Power BI Group Meeting on February 6th (Lakehouse in an Hour)
Suppose you need to calculate a percentage of grand total measure. Easy, you can use the Power BI “Show value as” without any DAX, right? Now suppose that you have 50 Table visuals and each of them require the same measure to be shown as a percentage of total. Although it requires far more clicks, “Show value as” is still not so bad for avoiding the DAX rabbit hole. But what about if you need this calculation in another measure, such as to implement a weighted average? Now, you can’t reference the Microsoft-generated field because it’s not implemented as a measure.
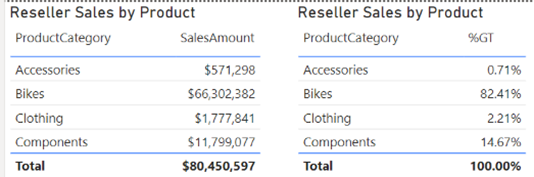
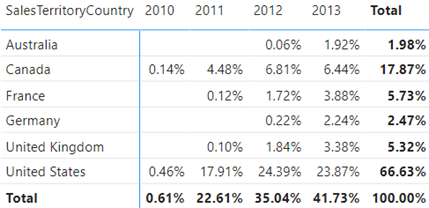
That’s exactly the scenario I faced while working on a financial report, although at the end I followed another approach to calculate the weighted average that didn’t require a percentage of total. Anyway, the question remains. Is there a way to implement a “generic” percent of grand total for a given measure that will work irrespective of what dimensions are used in a Table or Matrix visuals? Consider the following simple report.
We want to show sales as a percentage of total irrespective of what dimension(s) are used in the report. Typically, to implement percentage of total measures you’d implement a DAX explicit measure that overwrites the filter context, such as:
This measure uses the ALL function to remove the filter from the Product table to calculate the sales across any field in that table. But we want this measure to work even if fields from other tables are used as dimensions.
Enter the magical ALLSELECTED function. From the documentation, ALLSELECTED “removes context filters from columns and rows in the current query, while retaining all other context filters or explicit filters”, which is exactly what’s needed. That’s because we want to ignore the context from fields used in the visual but apply other filters, such as slicers and visual/page/report filters, and cross filtering from other visuals.
And that’s all to it except if you need a percentage of column total in a Matrix visual that has a field in the Columns bucket. In this case, ALLSELECTED will ignore not only the dimensions on rows but also dimensions on columns. Then, the net effect will be a generic measure that calculates the percent of grand total instead of column total.
By the way, if you use the “Show value as” built-in feature and capture the query behind the visual, you’ll see that Microsoft follows a rather complicated way to calculate it to handle this scenario. Specifically, the visual generates two queries, where the first computes the visual totals and the second computes the percentage of total.
https://prologika.com/wp-content/uploads/2016/01/logo.png00Prologika - Teo Lachevhttps://prologika.com/wp-content/uploads/2016/01/logo.pngPrologika - Teo Lachev2023-01-26 09:59:572023-01-26 09:59:57Implementing “Generic” Percent of Grand Total in DAX
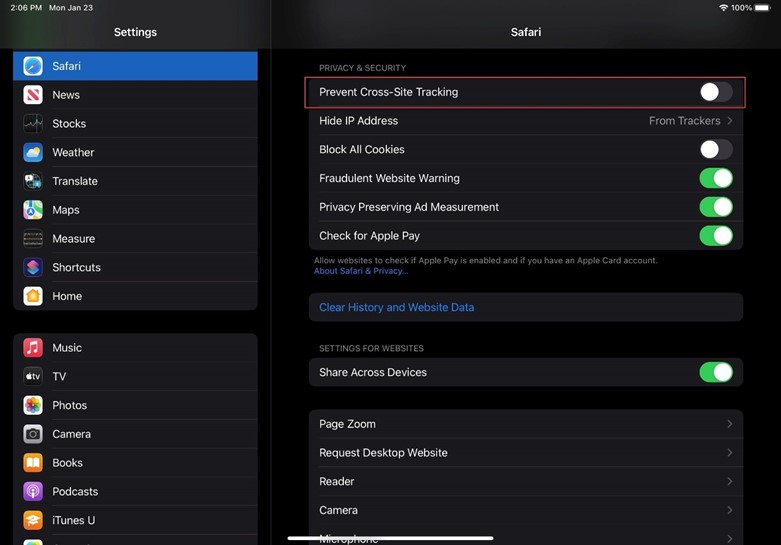
Scenario: You have an intranet web portal and use the Power BI secure embed feature (from the report menu, File->Embed report->Website or portal) to embed a report. However, the report doesn’t render on iPad and iPhone devices. Instead, the user is perpetually asked to authenticate with Power BI.
Solution: Apple has started preventing cross-site cookies to tighten up security. To resolve this horrible issue, each user must turn off this feature. On their iPad or iPhone device, go to Settings > your browser app, such as Safari or Chrome, and set Present Cross-Site Tracking to Off (assuming you are using Safari to render the web page).
https://prologika.com/wp-content/uploads/2016/01/logo.png00Prologika - Teo Lachevhttps://prologika.com/wp-content/uploads/2016/01/logo.pngPrologika - Teo Lachev2023-01-24 11:41:362023-01-24 11:42:46Solving iPad Issues with Power BI Secure Embed