One question that always pops us during my Power BI assessments for companies planning to adopt Power BI is which SKU to buy. The choice might seem obvious to your organization, but there is much more below the surface. Join this session and learn important considerations that might influence your decision, including:
• Licensing cost
• Hosting organizational semantic layers
• External reporting
• Features
• On-premises reporting
https://prologika.com/wp-content/uploads/2016/01/logo.png00Prologika - Teo Lachevhttps://prologika.com/wp-content/uploads/2016/01/logo.pngPrologika - Teo Lachev2019-10-13 14:31:152019-10-13 14:32:52Presenting at SQL Saturday Atlanta (BI Edition)
MS BI fans, join us for the next Atlanta MS BI and Power BI Group meeting on October 7, Monday, at 6:30 PM at the Microsoft office in Alpharetta. Qubole will show us how Presto, Azure Data Lake, and Power BI can be used to analyze Big Data. Qubole will sponsor the meeting. For more details, visit our group page and don’t forget to RSVP (fill in the RSVP survey if you’re planning to attend).
Presentation:
Leveraging Power BI on Presto for the Azure Data Lake
Date:
October 7, 2019
Time
6:30 – 8:30 PM ET
Place:
Microsoft Office (Alpharetta) 8000 Avalon Boulevard Suite 900 Alpharetta, GA 30009
Overview:
Presto is a distributed ANSI SQL engine designed for running interactive analytics queries. Presto outshines other data processing engines when used for business intelligence (BI) or data discovery because of its ability to join terabytes of unstructured and structured data in seconds, or cache queries intermittently for a rapid response upon later runs. Presto can also be used in place of other well-known interactive open-source query engine such as Impala, Hive or traditional SQL data warehouses. Attend this event to learn:
· Why Presto is better suited for ad-hoc queries than other engines like Apache Spark
· How to jumpstart analysts across your organization to harness the power of your big data
· How to generate interactive or ad hoc queries or scheduled reports using Presto
· Real-world examples of companies using Presto
Speaker:
Man Zhang is a Solutions Architect at Qubole. He has 20+ years in software systems architecture, development, and integration and 4+ years in Big Data architecture. https://www.linkedin.com/in/man-zhang-34a887/
Sponsor:
Qubole delivers a Self-Service Platform for Big Data Analytics built on Amazon Web Services, Microsoft and Google Clouds. We were started by the team that built and ran Facebook’s Data Service when they founded and authored Apache Hive. With Qubole, a data scientist can now spin up hundreds of clusters on their public cloud of choice and begin creating ad hoc and/or batch queries in under five minutes and have the system autoscale to the optimal compute levels as needed. Please feel free to test Qubole Data Services for yourself by clicking “Free Trial” on the website.
Prototypes with Pizza
TBD
https://prologika.com/wp-content/uploads/2016/01/logo.png00Prologika - Teo Lachevhttps://prologika.com/wp-content/uploads/2016/01/logo.pngPrologika - Teo Lachev2019-10-01 14:24:072021-02-17 01:02:02Atlanta MS BI and Power BI Group Meeting on October 7th
We all need to share. But until a couple of months ago, a Power BI training or assessment wouldn’t be complete unless I got hammered on the Power BI sharing limitations. Fortunately, Microsoft has addressed most of these and I have now a much better story to tell. And this is the subject of this newsletter.
You can now control who can create workspaces in the Power BI Admin center
Group membership limitations
V2 workspaces support all O365 group types
Coarse content access level
Contributor and Viewer roles
No cross workspace sharing
A dataset can be shared across workspaces
No data governance
A dataset can be promoted and certified
Power BI Premium sharing with viewers require report sharing or apps
The Viewer role supports sharing with viewers
Only one app supported per workspace
The Viewer role deemphasizes apps
No nesting support (subfolders)
Sharing Best Practices
Given the current state of Power BI, I’d like to share some best practices for organizing and sharing content:
Don’t use report and dashboard sharing as it can quickly turn into a maintenance nightmare.
Create workspaces to reflect your organizational functional areas, e.g. Sales, HR, Finance. Unfortunately, workspaces still don’t support subfolders (Microsoft hinted that they are working on such a feature), so for now you must resort to a flattened list.
Instead of individual user assignments, add users to security groups and then add these groups as members to the workspace. This way, when the user leaves and company or moves to another department, you only need to change the user’s group membership without making changes to the workspace security policy.
Come up with data governance policy. The Power BI data governance story is work in progress, but you can set up some ground rules. For example, once a contributor believes that a dataset is ready for a broader consumption, he can promote the dataset. Then, IT can verify the dataset and certify it. Currently, Power BI supports certifying only datasets (reports and dashboards aren’t certifiable yet).
This one is hard. Teach data analysts best data modeling practices. Instead of creating a dataset per report, they should create a data model that correctly represents their subject area. A data analyst should create the model once so it can support multiple reports. Once the dataset is published and certified, users can create their own reports.
Although Microsoft is pushing apps very hard and adding some nice features, such as navigation, a standing limitation is that you can create only one app per workspace. So, you can’t publish multiple apps from a workspace, such as to share some reports with one group of users and another set with a different group. Instead, grant access directly to workspaces by using the Contributor and Viewer roles. The Viewer role lifts a significant limitation that forced you to use report/dashboard sharing or apps to share content out of a premium workspace with viewers. If you want to share the entire content of the workspace, you don’t have to use apps. Instead, you can simply add users or groups as viewers to the workspace.
Despite some long standing limitations, Power BI sharing is coming out of age. Follow the above practices and you’ll have now a much better way to organize and share content.
Teo Lachev Prologika, LLC | Making Sense of Data Microsoft Partner | Gold Data Analytics
MS BI fans, join us for the next Atlanta MS BI and Power BI Group meeting on September 10, Tuesday, at 6:30 PM at the Microsoft office in Alpharetta. This is a meeting not to miss. A DAX founder, Jeffrey Wang (Principal Software Engineer Manager at the Power BI product group) is coming all the way from Seattle to share DAX best practices with our group! Captech Consulting will sponsor the event. For more details, visit our group page and don’t forget to RSVP (fill in the RSVP survey if you’re planning to attend).
Presentation:
Common DAX Patterns
Date:
September 10, 2019
Time
6:30 – 8:30 PM ET
Place:
Microsoft Office (Alpharetta)
8000 Avalon Boulevard Suite 900
Alpharetta, GA 30009
Overview:
We will learn common DAX patterns by examining several issues frequently reported by DAX users through PowerBI customer support tickets. Users will be able to:
1. Learn from mistakes made by other DAX users so you can avoid them in your own work.
2. Learn the common techniques to debug DAX problems.
3. Learn the best DAX patterns to solve common problems.
4. Gain deeper understanding of DAX by learning relevant history and underlying design of the programming language.
5. Ask me their own DAX questions
Speaker:
Currently working as Principal Software Engineer Manager at Microsoft, Jeffrey Wang stumbled upon BI after the Y2K bubble burst, fell in love with the field, and stayed in the industry ever since. After I joined Microsoft Analysis Services engine team in 2004, I quickly discovered that working on the programming language is the best way to stay close to the end users, so I joined the MDX formula engine team. After shipping a couple of releases of SQL Server Analysis Services, I joined the committee that created DAX. Today I lead the development effort of the DAX engine and the modeling engine inside the Power BI product group.
https://prologika.com/wp-content/uploads/2016/01/logo.png00Prologika - Teo Lachevhttps://prologika.com/wp-content/uploads/2016/01/logo.pngPrologika - Teo Lachev2019-09-03 20:36:472021-02-17 01:02:01Atlanta MS BI and Power BI Group Meeting on September 10th
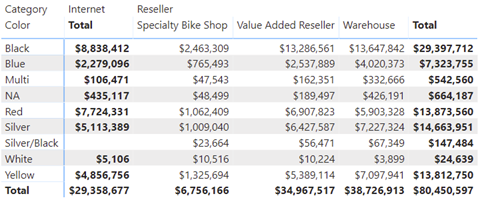
A recent requirement called for an asymmetric crosstab report in Power BI. Transitioned to Adventure Works, the final report looks like this.
The Internet column shows the sales amount from FactInternetSales. Then, the matrix pivots on the BusinessType column in the FactResellerSales. Because, Internet sales don’t relate to BusinessType, it doesn’t make sense to pivot it. Instead, we want to show Internet sales in a single static column before the crosstab portion starts.
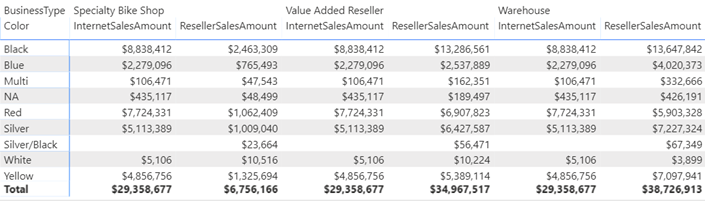
Implementing such a report in SSRS is easy thanks to its support of adjacent groups and static columns but not so much in Power BI. The issue is that Matrix would happily pivot both measures and the InternetSalesAmount would be repeated for each business type.
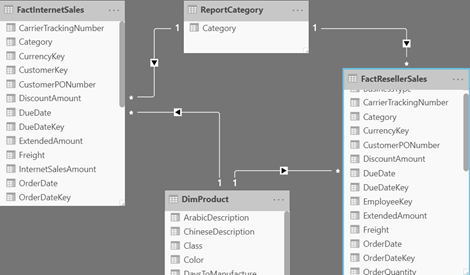
Fortunately, with some blackbelt modeling and DAX, we can achieve the desired effect. I attached the pbix file and here are the high-level implementation steps:
Add a ReportCategory table (you can use the Enter Data feature), with a single column Category and two values: Internet and Reseller. Add a Category calculated column to FactInternetSales with a value of “Internet”. Add a Category calculated column to FactResellerSales with a value of “Reseller”. Create relationships FactInternetSales[Category]->ReportCategory and FactResellerSales[Category]->ReportCategory. These relationships are required because Matrix doesn’t support unrelated tables. Your model schema should look like this:
Create a SalesAmount measure with the following formula:
SalesAmount = IF(SELECTEDVALUE('ReportCategory'[Category]) = "Internet" && NOT ISINSCOPE('FactResellerSales'[BusinessType]),
SUM(FactInternetSales[InternetSalesAmount]),
SUM(FactResellerSales[ResellerSalesAmount]))
The IF condition checks if the measure is under the Internet category. NOT ISINSCOPE(‘FactResellerSales'[BusinessType]) will return TRUE only for the total column in the Internet section. Otherwise, it will return the reseller sales. Because there are no reseller sales in the Internet category, only Internet sales will be shown. Note that SELECTEDVALUE will return FALSE for empty cells which is why I had to create the ReportCategory table.
Add Matrix viz and bind Product[Color] to rows, ReportCategory[Category] and ResellerSales[BusinessType] on columns, and SalesAmount in Values. Expand the columns to the next level (to show the BusinessType level).
In the Matrix format properties, go Subtotals, enable the “Per column” setting, and turn off the Category subtotal to avoid showing the reseller sales total twice.
Although Power BI has made great progress on the visualization side of things, it still lacks in flexibility. The two features that miss the most from SSRS are nesting visuals (to create repeat sections) and the flexible Matrix layout. However, with some black belt modeling and DAX, workarounds are possible.
https://prologika.com/wp-content/uploads/2016/01/logo.png00Prologika - Teo Lachevhttps://prologika.com/wp-content/uploads/2016/01/logo.pngPrologika - Teo Lachev2019-08-24 18:14:202019-08-24 18:14:20Implementing Asymmetric Crosstab in Power BI
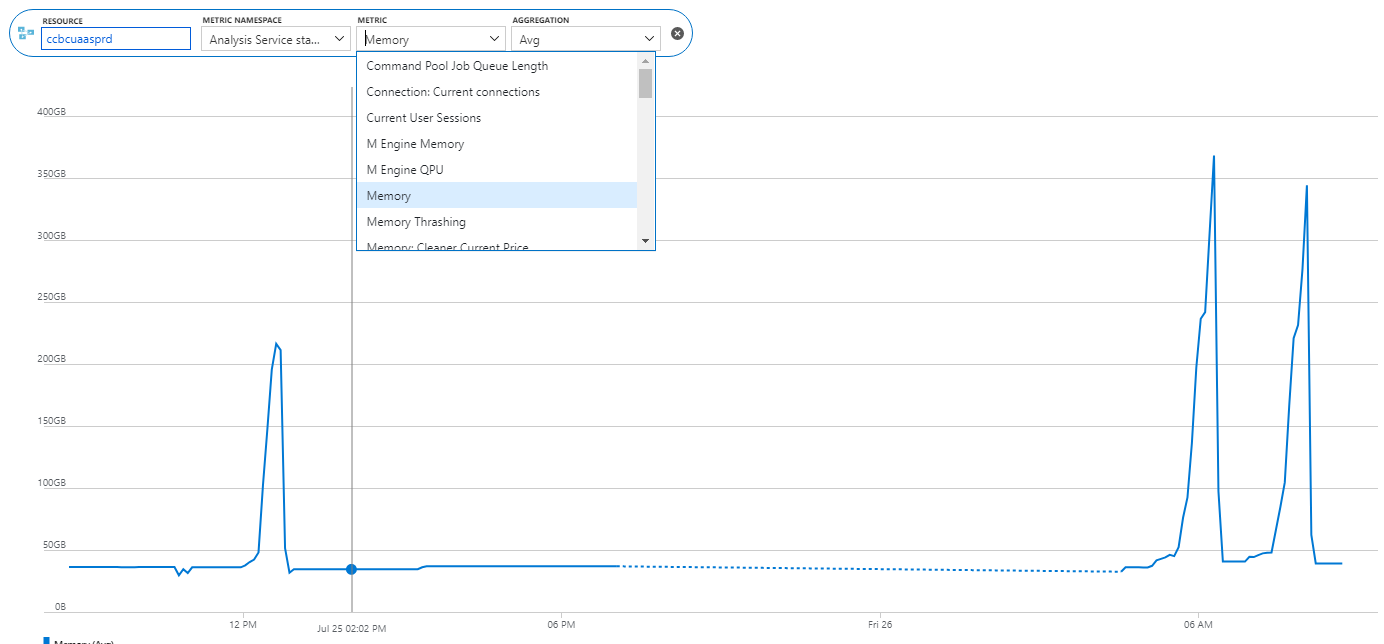
Scenario: A client reports a memory spike during processing. They have a Tabular semantic model deployed to Azure Analysis Services. They fully process the model daily. The model normally takes less than 50 GB RAM but during processing, it spikes five times and Azure Analysis Services terminates the processing task complaining that it “reached the maximum allowable memory in our pricing tier”. Normally, fully processing the model should take about twice the memory but five times?
Solution: Upon expecting the model design, I discovered that the client has decided to add (many) calculated columns to the two fact tables in the model. Most of these columns are used to calculated variances to prior year. The formulas contain DATESYTD and other DAX date-related functions. After data is read, Tabular processes calculated columns, relationships and hierarchies. In this case, the spike was due to calculations involving large time ranges and ineffective DAX expressions. Converting these columns to measures resolved the issue.
As a best practice, abstain from using calculated columns (especially in fact tables). Make sure you understand the difference between measures and calculated columns (I cover this extensively in my latest book “Applied DAX with Power BI“). If you do need expression-based columns, such to materialize expensive calculations, consider defining them upstream, such as in SQL views or Power Query.
A data gateway is required for a cloud service, such as Power BI, to access on-prem data, either for live connections or for refreshing imported data. The gateway picked up an interesting feature to look up Active Directory on one property and return the value of another, which proved extremely useful for one client of mine.
Scenario: An enterprise client has adopted a hybrid architecture I set up for them, where Power BI reports connect directly to an on-prem Analysis Services Tabular model. The issue is that besides the regular network login, every user has a cloud identity (the employee number) to access cloud data sources. Before the gateway enhancement, this required explicit per-user mappings in the gateway data source. Imagine you must do this for thousands of users. and you’ll understand the maintenance issue they faced rolling Power BI across the enterprise.
Solution: Instead of explicit mappings, all they need to do now is configure the following two settings in the Microsoft.PowerBI.DataMovement.Pipeline.GatewayCore.dll.config file:
When a Power BI user opens a report connected live to the on-prem Analysis Services Tabular model, the gateway receives the request mapped to the email that the user logs in Power BI. Then, the gateway queries the Active Directory to look up the user principal name (login) based on the employeeNumber which is what the Power BI login is. This query should complete fairly quickly so no worries about report queries. Make sure you restart the gateway after the configuration change.
A recent engagement brought an interesting dilemma. An ISV wanted to embed Power BI reports in a SharePoint Online portal accessible by their customers. The app handles user authentication and authorization by following the “App owns data” pattern. However, apparently inspired by the Stalin’s “No man, no problem” motto, SharePoint has decided to throw away custom server-side code, so we couldn’t add an ASP.NET page to obtain the embed token. This left us with two choices:
A pure JavaScript implementation – The main advantage of this option is that we could simply write a SharePoint client web part that handles the entire Power BI Embedded integration in JavaScript only. The major downside is that any JavaScript code is not secure, and this approach has a security vulnerability because you must store passwords in client-side code.
Implement a separate app – You can implement a separate service, such as an Azure Function app to handle tokens. Eventually, we ended up going this path because it’s more secure.
I attach the Node.js code if you need a pure JavaScript solution. The code uses a service principal authentication (follow the steps in the “Service principal with Power BI” document to configure it).
Important: If you decide to follow this path, please do your best to obfuscate the client secret because if the hacker gets access to the client-side code, the hacker can obtain that secret.
One could argue that if a hacker gets access to the user’s computer, you have a much bigger issue than going through JavaScript files to get the secret, but there is a security vulnerability, nonetheless.
https://prologika.com/wp-content/uploads/2016/01/logo.png00Prologika - Teo Lachevhttps://prologika.com/wp-content/uploads/2016/01/logo.pngPrologika - Teo Lachev2019-07-27 17:38:292021-11-29 17:08:21Embedding Power BI Reports in JavaScript
Got awarded for the elite Microsoft Most Valuable Professional (MVP) – Data Platform award again. I’ve been recognized by Microsoft for my expertise and contributions to the community for every year since 2004! Learn more about the MVP program at https://mvp.microsoft.com/en-us/Overview.
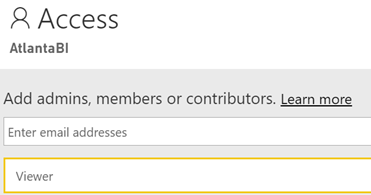
“Viewer role requires a Pro license or for the content to be in Power BI Premium. If your workspace is in Premium, users with Viewer role who don’t have a Pro license can view the workspace in the workspaces list, navigate to the workspace, and view the content without getting a Pro Trial prompt.”
Therefore, the Viewer role lifts a significant limitation that forced you to use report/dashboard sharing or apps to share content out of a premium workspace with viewers. So, if you want to share the entire content of the workspace, now you don’t have to use apps. You can simply add users or groups as viewers to the workspace.
Speaking of apps and selective sharing, my joy will be complete once workspaces supports nesting (folders) with the ability to overwrite the securing permissions at a folder level so we can have SSRS-like folder-based security. This will allow you to organize content anyway you want (instead of resorting to a flatten list of workspaces) and grant selective permissions to different groups of users. Now I have a much better Power BI sharing story to tell!
https://prologika.com/wp-content/uploads/2016/01/logo.png00Prologika - Teo Lachevhttps://prologika.com/wp-content/uploads/2016/01/logo.pngPrologika - Teo Lachev2019-06-27 17:24:332019-06-27 17:24:33The Power BI Viewer Role


 We all need to share. But until a couple of months ago, a Power BI training or assessment wouldn’t be complete unless I got hammered on the Power BI sharing limitations. Fortunately, Microsoft has addressed most of these and I have now a much better story to tell. And this is the subject of this newsletter.