Continuing the line of thought from my previous blog “Microsoft Unveils BI Roadmap”, one nagging question still remains. What to do with all these Excel files now that SSRS came with a vengeance and has been promoted to THE on-premises BI platform? It looks like Microsoft is thinking along these lines. Interestingly, Excel Services will be removed from SharePoint Server 2016 and replaced with Office Online Server, as explained here. And this page gives more details about Office Online Server which is currently in preview. In a nutshell, Excel rendering would work pretty much in the same way as in SharePoint Server 2013. The most common scenario that Microsoft plans now is to have the Excel workbook in SharePoint. When you open the workbook, SharePoint will redirect you to the Office Online Server using a WOPI frame (some sort of an Iframe), with some special tokens that enable Office Online Server to retrieve the workbook from SharePoint, and then render it as usual. This will work for Power Pivot models as well. Office Online Server (OOS) also supports loading Excel files from OneDrive which is how Power BI Excel rendering works today.
But wouldn’t be nice to extend SSRS 2016 and integrate with OOS so that you can deploy Excel reports to a report server installed in native mode? This would allow SSRS to handle all of the important Microsoft report formats (SSRS, Datazen, Power BI Desktop, and Excel). If OOS doesn’t require a SharePoint license, this will be a great value proposition as well as you will save you a SharePoint Server Enterprise Edition license. This is precisely the wish I communicated to Microsoft and posted it on the Excel wish list. Please vote if you like the idea.
You know that there is an Excel wish list site, right?
Today at the SQL PASS Summit 2015, Microsoft shared its BI roadmap for next year and beyond. The BI cloud roadmap shouldn’t be a surprise to anyone. It’s centered around Power BI. The main takeaway about the on-premises roadmap is deemphasizing the role of SharePoint and Office in favor of Reporting Services. In SQL Server 2016, SSRS will be extended to support Datazen reports. A future SQL Server update would support publishing Power BI Desktop files as well.
“Just as we’ve added mobile report delivery to SSRS in SQL Server 2016, we intend to add governed Power BI Desktop report delivery in the future.”
Although this news will surely cause some commotion in a short term, I believe it’s a good news for customers and BI practitioners in a long term. For customers, you no longer need SharePoint and SQL Server Enterprise licenses if all you need is sharing some reports and dashboards. So, this move brings significant cost savings in both software licenses and operational expenses. However, if you have invested in SharePoint you can continue using its BI features in SharePoint Server 2013 and beyond. For BI practitioners, you no longer need to deal with SharePoint complexities. MVP and the community have been asking for years for a simplified deployment model and now we have it. And removing SharePoint and Office dependencies will remove adoption barriers caused by aligning release cycles across different Microsoft product groups.
I’m personally glad that SSRS was chosen as the workhorse of the on-premises BI roadmap. SSRS is a mature product and it’s a natural choice to step up to its new role. Apparently, it’s not trivial to decouple the Power BI Service from all the Azure backend infrastructure so we can host it on premises. Long live SSRS!
UPDATE: An updated sample is included in the Chapter 12 source code of my “Applied Power BI” book.
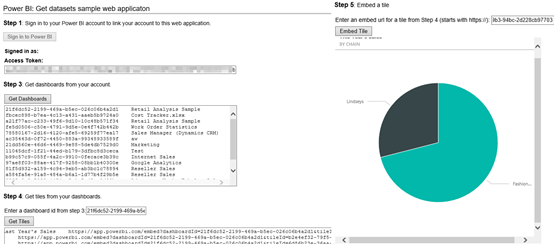
One of the biggest Power BI strengths is its open architecture. In addition to opening the visualization framework, Power BI introduced REST APIs that let developers embed dashboard tiles in custom web applications (embedded reports will probably follow soon). Microsoft provided a sample application (Integrate-a-tile-into-an-app) on GitHub to demonstrate how dashboard tile embedding works. This application navigates the user to an authentication UI where the user signs it to Power BI before the application can access the user content. However, there are plenty of embedded reporting scenarios where this isn’t desirable. For example, you might have a web application that already authenticates users with Forms Authentication and you don’t want to ask the user to log in to Power BI again. Instead, you might want to pass the identity of the authenticated user to Power BI. In the more advanced (but increasingly common) scenario, you would want Power BI to pass the user identity all the way to an on premises Analysis Services model so that data security works.
The bad news is that currently Power BI doesn’t support custom security. Custom security is on the roadmap but currently you can’t pass application users to Power BI. This isn’t as bad as it sounds. For example, if you have a limited number of users or external customers, you can register them in Power BI so that you know their Power BI usernames and passwords. For example, if my company does business with Acme1 and Acme2, I could register acme1@prologika.com and acme2@prologika.com with PowerBI. Then, once the acme1 user authenticates with my web application and request a dashboard, I can authenticate the user with acme1@prologika.com to Power BI.
The good news is that Power BI supports OAuth2 for security. OAuth2 is a very flexible security mechanism and it supports different flows via the grant_type parameter. One of the flows that it supports is the grant_type=password flow that allows you to avoid the Power BI authentication UI step if you know the user credentials. This is conceptually similar to how Basic Authentication works. The OAuth2 grant_type=password scenario is also referred to as two-leg authentication (the three-leg authentication is when the Authentication UI is involved).
To demonstrate this, I’ve made changes to the Microsoft sample app and uploaded the modified sample (attached to this blog). Configure it in Visual Studio as follows:
In the application settings, change the ClientSecret, ClientID, UserName, and Password to match your setup. You obtain ClientID and ClientSecret when you register the application with Azure AD. The username and password must match the credentials of a registered Power BI user.
In the application Build tab, make sure that the NOLOGIN conditional symbol exists.
Right-click on the project and then click Manage NuGet packages. Download and install all referenced packages as they are not packaged with the sample to reduce size.
Run the application. The “Sign in to Power BI” button should be disabled. When you click Get Dashboards, the app should be able to retrieve the dashboards on behalf of the Power BI user. From this point on, the app works as per the original sample. Again, the big difference is that the Authentication UI is not shown because you don’t need to collect the user credential.
Special thanks to the Power BI Team and Rui Quintino by DevScope for sharing insights. For more information about how APIs for embedded dashboard tiles work, read the “Power BI API updates roundup” blog by Lukasz Pawlowski.
In summary, the sample demonstrates how you can use OAuth2 two-leg flow to avoid authenticating the user twice and redirecting to the Power BI authentication dialog. As a disclaimer, this is not a production-ready sample (there are hardcoded links, no error handling, no refresh token flow, etc.).
https://prologika.com/wp-content/uploads/2016/01/logo.png00Prologika - Teo Lachevhttps://prologika.com/wp-content/uploads/2016/01/logo.pngPrologika - Teo Lachev2015-10-19 13:43:002021-02-16 04:59:56Power BI Embedded Dashboards Without Authentication UI
Microsoft awarded me again with the Most Valuable Professional (MVP) Award for SQL Server. This is an annual prestigious award given to selected individuals worldwide in recognition for their expertise and contribution to the community. Currently, there are 371 SQL Server MVPs worldwide and only 85 in the USA. This makes it 12 consecutive years for me as SQL MVP!
https://prologika.com/wp-content/uploads/2016/01/logo.png00Prologika - Teo Lachevhttps://prologika.com/wp-content/uploads/2016/01/logo.pngPrologika - Teo Lachev2015-10-06 12:17:022016-02-12 06:50:06SQL Server MVP for 12 Years
Come and join us on Monday, September 28th, for our next Atlanta MS BI Group meeting. The topic this time is “Enhancing Data Analysis and Predictive Analytics with NoSQL” delivered to you by RDA Consulting.
Presentation:
Enhancing Data Analysis and Predictive Analytics with NoSQL
Level: Intermediate
Date:
Monday, September 28th, 2015
Time
6:30 – 8:30 PM ET
Place:
South Terraces Building (Auditorium Room)
115 Perimeter Center Place
Atlanta, GA 30346
Overview:
The pervasiveness of Big Data has created significant challenges for companies that have historically utilized relational database management systems to perform data analysis and predictive analytics. This presentation outlines the challenges that stem from Big Data as it relates to deriving value from data, the types of NoSQL data stores available and how NoSQL can serve as a data platform that enhances the data analysis and predictive analytics capabilities of companies.
Speaker:
Cornell A. Emile is a Senior Software Engineer with RDA Corporation. Since 2001, he has designed, developed, and maintained a data-centric solutions within multiple industries such as Finance, Digital Marketing, State and Federal Government using Microsoft’s BI stack. His main interests include database performance tuning, ETLs, Business Intelligence and NoSQL.
Sponsor:
RDA provides specific enterprise solutions that integrate software, managed services, and the value of the cloud. We help you assess the best platforms, then design, build, implement and support tailored business solutions that optimize to your specific cost, scale, mobility and security needs.
https://prologika.com/wp-content/uploads/2016/01/logo.png00Prologika - Teo Lachevhttps://prologika.com/wp-content/uploads/2016/01/logo.pngPrologika - Teo Lachev2015-09-26 23:39:322016-02-12 06:52:05Atlanta MS BI Group September 28th Meeting
For years I’ve been harassing Microsoft to support embedding interactive reports connected to SSAS on custom apps. This feature has been sorely missing in the Microsoft BI stack. Yet, it’s a must-have feature that enables a wide range of integration scenarios, such as customer-facing reporting. Imagine your customers being able to ask natural questions for data exploration. This is a killer feature!
It looks like Power BI might finally bring some relief. I while back, I posted an Embedding Reporting feature wish on the Power BI discussion list. It now has 643 votes and it’s one of the most voted for features. Recently, when asked to provide feedback, I communicated to Microsoft how I envision report embedding to work:
Developers must have the ability to embed reports/dashboards in applications. This should be conceptually similar to how they can do this now with ReportViewer. However, instead of an ASP.NET control, I’d imagine REST APIs with jQuery.
The tricky part is security. It is paramount to be able to pass the user identity to on-premises SSAS models. Ideally, we don’t want to ask external users to register in Power BI. Instead, some kind of bulk licensing needs to be supported to allow requests to Power BI to go under a single trusted account but yet pass the user identity to SSAS.
In a nutshell, the external user goes to the customer website and he’s authenticated using whatever authentication mechanism the app uses. Then, a call is made to Power BI to authenticate using a trusted account. When the user requests a report, the call must allow somehow passing the user identity. And, then this identity needs to flow to SSAS. Previously, to achieve this scenario and circumvent the SSAS limitation of supporting Windows security only, developers would add a CustomData connection string to the SSAS connection so that SSAS can use it for row-level security.
Recently, Lukasz Pawlowski (a Senior Product Manager formerly on the SSRS team and now heading the Power BI APIs) responded:
“Quick update here. While it’s not report embedding, we just announced a preview of an API to integrate dashboard tiles into applications. Read about it on the Power BI Developer blog”
So, it looks like the first wave of the embedding APIs has arrived. While it’s not what we need, I think we can expect full-featured embedding to arrive soon.
https://prologika.com/wp-content/uploads/2016/01/logo.png00Prologika - Teo Lachevhttps://prologika.com/wp-content/uploads/2016/01/logo.pngPrologika - Teo Lachev2015-09-26 23:34:002021-02-16 04:59:54Power BI Report Embedding on the Horizon
I’m optimizing a SQL Server OLTP mirrored database hosted on an Azure VM. After load testing, it was clear that CPU is the primary resource constraint so I suggested an upgrade to a higher A-series machine alongside other reconfiguration and storage changes. Meanwhile, I’ve noticed that starting in October, the D-Series pricing goes down. Moreover, D-series include a SSD temporary drive to host the temp database and buffer extensions. And, according to Microsoft, D-series have “60% faster processors than the A-series”. In this case, to save the customer money, I recommended a D-Series VM with less cores than the A-series VM upgrade I had in mind.
https://prologika.com/wp-content/uploads/2016/01/logo.png00Prologika - Teo Lachevhttps://prologika.com/wp-content/uploads/2016/01/logo.pngPrologika - Teo Lachev2015-09-21 12:35:002016-02-12 06:59:31Azure D-Series VM Prices Go Down
Scenario: You’re conducting a capacity planning effort and load testing an Azure website (Azure App Service) that saves data to SQL Server running on Azure VM. You’ve created a load test, e.g. using Visual Studio, and you’ve realized that the throughput caps for no obvious reason. SQL Server and Azure performance counters indicate that both layers are not under pressure.
Solution: Although no specifics are provided by Microsoft, it appears that Azure throttles user loads to prevent denial-of-service attacks. Based on my observations, Azure detects that the requests come from the same IP and caps the requests. As a workaround, consider conducting the load test using Visual Studio Online. Visual Studio Online allows you to distribute the test across multiple agents that can use different IP addresses (configurable as a test property). In our case, this allowed us to conduct successfully a stepped load test until we reached a performance bottleneck. Interestingly, in this case the bottleneck we first reached was CPU utilization on the front end even although we scaled it to three large Azure web instances. SQL Server was churning along just fine with a single data disk. You results might differ of course.
Our next Atlanta MS BI Group meeting will be on August 31st. This happens to be our 5th anniversary! Thanks for everybody who contributed to the group success! We’ve come a long way since our first meeting with a dozen people to the attendance we enjoy today of 60-70+. Come and join the festivities and learn about sentiment analysis with Big Data & Machine Learning.
Presentation:
Tone/Sentiment analysis with Big Data & Machine Learning
Level: Intermediate
Date:
Monday, August 31th, 2015
Time
6:30 – 8:30 PM ET
Place:
South Terraces Building (Auditorium Room)
115 Perimeter Center Place
Atlanta, GA 30346
Overview:
People’s sentiments and opinions are written in social networks. There are tweets, Facebook posts, book reviews, forum discussions, and more. These attitudes and feelings are communicated using text, with format depending on the social network. Twitter messages are limited to 140 characters and use hash-tags and Facebook messages can be longer.
This session reviews the different Natural Language Processing, text mining, and data mining techniques you can use for sentiment and tone analysis. Organizations can use the extracted knowledge for brand reputation, market predictions, and automatic learning. We’ll look at, Hadoop, data mining, Microsoft Big Data Hadoop distribution HDInsight and Azure Machine Learning.
Speaker:
Paco Gonzalez, a SolidQ Mentor, is the PASS Big Data Virtual Chapter Leader, SQL Saturday Barcelona Organizer and assistant at the PASS Atlanta BI User Group. He is finishing his PhD thesis about: “Analyzing Social Data with Machine Learning.” He is an MCT and MCP on BizTalk Server and SQL Server. He is coauthor of Microsoft Training Kit 441. Paco is a frequent speaker at large and small conferences. SQL Saturdays, TechEds, PASS BA, PASS Summit, DevWeek London, and PAW Chicago and London.
Sponsor:
TEKSYSTEMS is a subsidiary of Allegis Group, the largest private talent management firm in the world. Our longstanding history and industry-leading position speak to our success in providing the IT staffing solutions, IT services and talent management insight required for you to actualize ROI and sustain a truly competitive advantage in a fast-changing market.
https://prologika.com/wp-content/uploads/2016/01/logo.png00Prologika - Teo Lachevhttps://prologika.com/wp-content/uploads/2016/01/logo.pngPrologika - Teo Lachev2015-08-27 23:53:102016-02-12 07:10:38Atlanta MS BI Group 5th Anniversary
Scenario: You have a date dimension table and typical date-related columns, such as DayOfWeek, WeekEndDate, etc. In US, weeks start on Sunday and end on Saturday (ISO weeks on the other hand start on Monday and end on Sunday). You have a requirement to overwrite the week start and end days for a Power Pivot, Tabular, or MD model. For example, while the Date table defines the week start day on Sunday, you might need to overwrite it to start on Monday.
Solution: I typically derive as many of the date calculations in a SQL view on top of the Date table instead of saving the results in the table itself. For example, the WeekOfYear calculation might look like this:
DATEPART(WEEK, [Date]) [WeekOfYear]
If you have date calculations like this, instead of changing all week-related calculations to reflect the desired week start day, the easiest way to offset the week day is to use the T-SQL SET DATEFIRST statement preceding the actual SELECT statement. The following example taken from Power Pivot/Tabular overwrites the first day of the week to start on Monday.