Power BI Custom Visuals Announced
Today Microsoft announced the general availability of Power BI on July 24th meaning that Power BI goes live on that date. Among the many new features mentioned in the blog, the one that piqued my interest is custom visuals. Developers might recall that SSRS has provided custom report items since version 2005, which I wrote about in the October 2006 issue of the MSDN Magazine. Similarly, now you can implement custom visualizations in Power BI! And, instead of writing .NET code, you can do so using JavaScript. This opens the path to implement custom visuals using any of the JavaScript-based visualization frameworks, such as D3, WebGL, Canvas, or SVG.
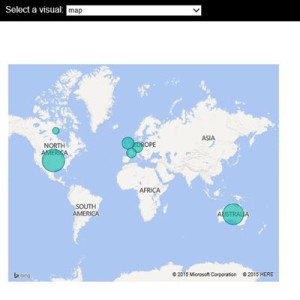
This will be huge as it will allow developers to extend the Power BI visualization capabilities using open-source visualization frameworks. Do you need some gadgets, like a bullet graph? With some coding wizardry, you can implement your own, such as by using the D3 Bullet Charts sample. Moreover, to speed up development, Microsoft has published the code of all of the existing Power BI visualizations on GitHub. Once you follow the instructions to install the Power BI Visuals Sample, you can open the project in Visual Studio and open in the browser index.html located in the PowerBIVisualsPlayground project. This allow you to test the visuals. The actual TypeScript code of the Microsoft visualizations is located in the Visuals project.
 I think the Microsoft decision to make Power BI open will be a paradigm shift for the BI industry. Besides the Push API which are already published, Microsoft has already indicated plans to make Power BI even more open, such as to allow developers to embed reports in custom web applications. Now, if only Power BI supports on-prem installation …


