Fixing Power View to SQL Server 2014 SSAS Multidimensional

Scenario: You have Power View integrated with SharePoint. You attempt to create a Power View report that connects to a SQL Server 2014 cube. The connection fails with “Internal Error: An unexpected exception has occurred”. The connection used to work or works with SQL Server 2012 SSAS MD.

Resolution: On the SSAS 2014 server, install Cumulative Update 2 for SQL Server 2014. This article provides more details about the issue.

Top 10 Reasons for Choosing Microsoft Self-service BI

Every organization should have a strategy for self-service BI. As a rule of thumb, my advice is that 80% of the BI effort should be directed toward implementing organizational BI solutions (DW, ETL, data model, dashboards, big data, predictive analytics, and so on), while 20% should be left for completing self-service BI analytics. But which tool to choose for self-service BI? With so many vendors on the market, it’s easy to get persuaded by marketing propaganda and eye candy. My advice would be to start with what you already have. And, what you have is probably Excel. It’s common when I talk to clients to find that they don’t realize that the most if not all of their self-service BI needs can be met by the Excel self-service BI capabilities, many of which are unmatched by the competition.

Microsoft has built a comprehensive self-service ecosystem marketed under the Power BI name umbrella that should warrant your serious interest for at least the following reasons:

Flexible Data Schema

Unlike other tools that are limited to importing a single dataset, Power Pivot allows you to import and relate multiple datasets so your business users can build sophisticated models on a par with organizational BI solutions.

Easy Data Acquisition

Unlike other vendors who assume programming and scripting knowledge for data import, importing data with Microsoft self-service BI adopts a wizard-driven approach for importing data. In fact, in Excel business users have several ways to bring data into the data model depending on the data complexity, including Excel native data import (great for working with text files), Power Pivot (great for working with relational and other data sources), and Power Query (even more data sources). Currently, the preferred approach for best performance is to cache the data into the state-of-the art xVelocity in-memory store, but Microsoft is adding pass-through query capabilities as well.

Data Transformation

I don’t think that there is a self-service tool on the market that allows you to transform the data before it’s imported. By contrast, Power Query to Microsoft self-service BI is what SSIS is to organizational BI. Power Query supports a variety of data transformation tasks, ranging from simple tasks, such as combining and splitting columns, to a full-featured M language for advanced transformations.

Powerful Programming Language

A BI solution is rarely complete without business calculations that can range from simple aggregations to rather sophisticated business metrics. The Data Analysis Expressions (DAX) is a full-featured analytical language that you’ll be hard-pressed to find in competing products.

Flexible Reporting

With a few clicks, business users familiar with Excel can use build Excel PivotTable and PivotChart reports connected to the Power Pivot data model. If you need more eye candy, Power View should help. While you might find that the current presentation toolset has left a room for improvement, check what’s coming up in Power BI vNext.

Performance and Scaling

Most popular self-service BI vendors offer desktop-based solutions that import data in files. When it comes to scaling out, these vendors fell short. By contrast, an organization that has adopted Microsoft self-service BI can easily scale out data models originated by Business to enterprise data models powered by Analysis Services and sanctioned by IT.

Q&A

Your users don’t know how to get started with the BI model someone else built? Everyone loves the Power BI Q&A feature that lets users type semantic questions, such as “show me sales for last quarter”. None of the popular self-service BI vendors have currently a similar feature, although it looks like startups, such as ThoughtSpot, are rallying to offer similar offering.

Flexible Deployment

Don’t use Excel or Office 365? Have SharePoint on premises or cloud? Don’t have or care about SharePoint? The coming Power BI vNext (free and paid versions) and Power BI Designer removes adoption barriers by allowing you to implement self-service BI outside Excel and SharePoint. My newsletter on this subject provides more details.


Cloud on Your Terms

If you are looking for a cloud-based BI platform, Power BI is just that. And, with Power BI vNext you don’t have to upload your data. Data can stay on premises, such as in a Tabular model or a cube, while your reports can be deployed to the cloud. Moreover, you are always up-to-date with the latest features.

Great Partner Ecosystem

One of the greatest strengths of Microsoft is having a great partner ecosystem and readily available talent.

Cost

OK, that’s the 11th reason but it’s hard to pass free given that the Power tools (Power Pivot, Power Query, Power View, and Power Map) are either bundled with Excel or available for download) and Power BI vNext cloud offering has a free Power BI Designer and a free cloud edition.

While Microsoft self-service BI is not perfect, it should warrant your interest if you are on the market looking for a tool. Sometimes, all we need to do is appreciate what we already have.
 

Introducing the Reimagined Power BI Platform

Come and join us for an information-packed meeting of the Atlanta Microsoft BI Group on February 23th. You will learn about Power BI vNext and Panorama Necto. Our sponsor will be Panorama.

  1. Introducing the Reimagined Power BI Platform by Jen Underwood, Microsoft
    You have seen glimpses of the new Power BI platform during the Public Preview reveal. Although it may not be apparent, Microsoft has totally reimagined the Power BI platform and user experience for BI professionals, developers and business users. In this new release, Microsoft has added Power BI Designer, developer APIs, custom templates/apps, hybrid direct connectivity to on-premise data sources without data copying, a native mobile BI app and other top secret enhancements that we can dive into by the time of this session. Please join me to further explore all these great changes and enjoy a fun demo-intensive session.
  2. Panorama Necto – Panorama Necto is advancing Business Intelligence 3.0 to the next level, bringing together the very best of Enterprise BI with Visual Data Discovery, providing enterprises with new ways to collaborate and create unique contextual connections.

Filtering Tables Dynamically in DAX

Sometimes, your DAX calculated measures might need to filter a table dynamically based on a certain condition. For example, you might have a Type 2 table like this one:

ClaimID

ClaimDate

ClaimStatus

RowStartDate

RowEndDate

XXX-1

1/1/2015

Open

1/1/2015

1/15/2015

XXX-1

1/1/2015

Approved

1/16/2015

12/31/9999

When a change is detected on the existing claim, this design expires the previous row and adds a new one. A common business question would be “How many claims do we have as of a given date?” Tabular is more flexible than MD answering this question because you can directly filter the table. In your first attempt, you might write the following calculated measure:

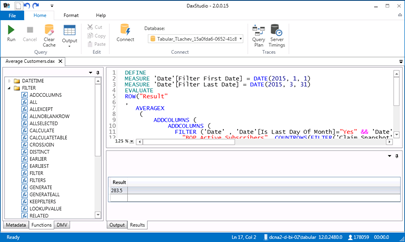
ClaimCount:=CALCULATE(DISTINCTCOUNT([ClaimID]), [RowStartDate]<=[FilterLastDate] && [FilterLastDate]<=[RowEndDate]))

Where FilterLastDate is another calculated measure that returns the max date if the user has selected a date range, such as an entire month from a Date hiearchy, so that the measure is evaluated as the last date of the user selection. However, this attempt fails with the error “A function ‘CALCULATE’ has been used in a true/false expression that is used as a table filter expression. This is not allowed.” This article provides more context although I personally believe that the explanation doesn’t give all the details as the second argument is Boolean in this case. To fix this you need a more complicated expression that uses the FILTER function:

ClaimCount:=CALCULATE(DISTINCTCOUNT([ClaimID]), FILTER(ALL(ClaimSnapshot[ClaimDate], ClaimSnapshot[RowStartDate], ClaimSnapshot[RowEndDate]), [RowStartDate]<=[FilterLastDate] && [FilterLastDate]<=[RowEndDate]))

The FILTER function does the same filtering logic. If the table you filter on is related to a Date table, such as on ClaimDate, you need to ignore its context. Otherwise, the calculated measure scope will be limited by the Date selection. To do so, you need to use the ALL function but because it returns a table, the result needs to include all columns that you need to filter on.

Finding Duplicates in DAX

A prerequisite for creating a relationship in Tabular/Power Pivot is to have a primary key column in the table on the One side of the relationship. This column must have unique values. If it doesn’t, the relationship won’t get created and you’ll get an error that the both tables have duplicate keys. If you have a relatively large table, it might be difficult to find the duplicates.

ID

Column1

1

Foo

2

Foo

1

Foo


However, given the above table design, you can add a simple calculated column to the table to return the count of duplicates for column ID using the following DAX formula

=CALCULATE (COUNTROWS(), ALLEXCEPT(Table1, Table1[ID]))

This expression uses the COUNTROWS() function to count the number of rows of Table1. Coupled with the CALCULATE function, this expression will be resolved in the context of every row. To ignore the column that you want to count on (ID in this case), you need to exclude it from the context, so that the row counting happens across the entire table for each ID value. Once the column is created, you can filter on it in the Data View to find out the duplicate rows with values 2, 3, etc.

My Wish List for SQL Server.vNext

In an attempt to give customers more transparency, Microsoft recently published a Cloud Platform Roadmap. The product groups are also actively seeking feedback for the on-premise products (also known as boxed products). For example, if you have subscribed to the Power BI.vNext public preview, you can use the BI in SQL vNext forum to provide feedback (not sure why there instead of on connect.microsoft.com).

So, here is my open high-level SQL Server.vNext wish list:

  • SSAS – Merge Multidimensional and Tabular and take best from both. I like the in-memory engine and flexibility of Tabular but at the same time I miss the MD pro features. To put this in perspective, I’d like to see the following features added to Tabular:
    • Additional relationship types, such as M2M relationships (it looks like this will happen judging by the Power BI features), multi-grain relationships (joining to a table at a higher grain than the key), role-playing
    • Scope assignments
    • Sets
    • MDX support for business calculations – BI pros have been learning MDX for the past 15 years so this knowledge shouldn’t be wasted. Besides, some constructs are better expressed in MDX not to mention that Tabular doesn’t have support for hierarchy navigation.
    • Enterprise scale features – parallel partition processing within a table, ability to define which columns will be hierarchized (measures typically shouldn’t, yet now every column is hierarchized), compression on calculated columns
    • Removal of DirectQuery limitations
    • Custom (non Windows-based) security – This applies to both MD and Tabular in order to allow developers to embed reports in custom applications.
    • Better toolset – No matter how good SSAS gets, it won’t go far if there is no good client support. Excel and Power View need catching up. For example, Excel need to generate DAX natively, optimize MDX queries (especially for detail-level reports), and add Power View support for MD, plus numerous enhancement to catch to modern interactive tools.
    • Tabular Designer enhancements – it’s painful to wait SSDT to refresh after every step.
  • SSRS
    • Report Designer should continue where it left off in 2010 when focus was shifted on Power View. See top requested features on connect.microsoft.com, especially in the area of report parameters.
    • Power View – conditional formatting, drillthrough, SSAS action support, mapping enhancements (region coloring, point-to-point mapping)
    • Ability to embed Power View reports in custom apps.
    • Data alerts on Power View and SSRS in native mode.
    • Q&A on prem
    • Bring Power BI features to boxed products. Since we decouple Power BI from SharePoint, installing it on a local IIS server shouldn’t be an issue.
  • SSIS – Project mode and development enhancements in 2012 were great but the product group should take a look at competing products, especially those that attempt to automate ETL. I don’t care much about the Data Flow since I typically use the ETL pattern, so I won’t comment on the data flow tasks.
    • Data profiling should be built in the data sources instead of separated as a separate task
    • Change management – make it easy to see what source mappings have changed. Don’t make me go through input and output connectors to fix these mappings when they change.
    • Scale out ETL across multiple servers
  • SQL Database Engine – Based on what I do, I need better support for data warehousing.
    • Improve query optimizer for large joins
    • Unify memory technologies – in most cases you want to have both in-memory tables and fast analysis.
    • Enhance clustered columnstore indexes to support additional regular indexes. See my post for more info.
  • MDS/DQS
    • Ideally, unify MDS and DQS into a single product as there is a significant overlap.
    • MDS Excel add-in is good but usability needs to be improved. No one wants to scroll a long pick list of a domain-based attribute to find something.
    • Ability to reference an entity from another model.

Microsoft is Serious about Statistical Analysis and Machine Learning

Microsoft announced two company acquisitions related to data analytics.

It announced that it will acquire Revolution Analytics. Revolution Analytics is the leading commercial provider of software and services for R, the world’s most widely used programming language for statistical computing and predictive analytics. This acquisition could help more companies use the power of R and data science to unlock big data insights with advanced analytics.

Previously, Microsoft also announced that it will acquire Equivio. Equivio is a provider of machine learning technologies for eDiscovery and information governance to help customers tackle the legal and compliance challenges inherent in managing large quantities of email and documents.

Demystifying Clustered Columnstore Indexes

Non-clustered columnstore indexes (NCCI) were introduced in SQL Server 2012 to improve the performance of large aggregate queries (common for data warehousing) with the caveat that there were read-only. Consequently, the ETL process has to drop NCCI, load the data, and recreate the columnstore index.

NOTE Building an index (columnstore or regular) should be a highly-parallel operation. Building a columnstore index in particular should max out all licensed cores. Currently, we have an open support case with Microsoft where a columnstore index allows adding a computed column (while it shouldn’t). Consequently, SQL Server builds the index using a single thread which may lead to excessive index creation times.

SQL Server 2014 introduced clustered columnstore indexes (CCI) which offer two main advantages:

  1. CCI is updatable — Therefore, you don’t have to drop and recreate the index anymore.
  2. Storage is greatly reduced — For example, you might have a fact table of 100 GB. Assuming x10 compression, your table space with NCCI will be 110 GB. However, if you create CCI the table space will be only 10 GB. This is why Analytics Platform System (previously known is PDW) uses CCI.

On the downside, CCI doesn’t support any other indexes that you might need to optimize ETL or speed up joins. Basically, CCI is the only index you can have on a table. However, CCI is not designed for equality and short-range queries that are typical for detail-level SELECT or MERGE queries. It’s a common misconception that you don’t need such indexes with CCI but this is not the case. I hope a future release of SQL Server enhances CCI to support regular indexes as well.

Presenting at Atlanta.MDF

I’m presenting at the Atlanta.MDF group on Monday, January 12th. I’ll be covering a wide range of tips and techniques for analyzing and improving performance of SQL Server-based data analytics solutions. Hope you can make it.

Title: Can Your Data Analytics Solution Scale?

Abstract: Does your ETL exceed its processing window? Do your users complain about the SSRS spinny? Can your SQL Server database design deliver the expected performance? Can the system scale to thousands of users? Join this session to learn best practices and tips for isolating bottlenecks and improving the performance of data analytics solutions. I’ll dissect the layers of a “classic” solution (relational database, ETL, data model, reports) and share solutions harvested from real-life projects to address common performance-related issues. 

SQL Server and 20 Cores Limit

Scenario: You execute a SQL Server 2012 task that uses parallelism, such as index rebuild or a query on a server with more than 20 cores running SQL Server 2012 Enterprise Edition. In the Windows Task Manager, you observe that the task uses only 20 cores. We discovered this scenario during a rebuild of a columnstore index. To confirm this further, you examine the SQL Server log and notice that a similar message is logged when the SQL Server instance starts:

“SQL Server detected 8 sockets with 4 cores per socket and 4 logical processors per socket, 32 total logical processors; using 20 logical processors based on SQL Server licensing. This is an informational message; no user action is required.”

Explanation: More than likely, you have upgraded to SQL Server 2012 from SQL Server 2008 R2 under Software Assurance. Microsoft created a special SKU of Enterprise Edition to support this scenario with the caveat that this SKU limits an instance to using only 20 processor cores (or 40 CPU threads if hyperthreading is enabled). If this level of parallelism is not enough, the only solution is to switch to the Enterprise Edition SKU that is licensed per core and purchase a license that covers as many cores as needed. Once you obtain the new license key, you can upgrade your SQL Server instance:

Setup.exe /q /ACTION=editionupgrade /INSTANCENAME=MSSQLSERVER /PID=<PID key for new edition>” /IACCEPTSQLSERVERLICENSETERMS