Looking for Talent

We have two contract positions in Alpharetta, GA. Contact us at info@prologika.com if you are interested.

BA ANALYST (4-MONTH CONTRACT)

Reviews, analyzes, and evaluates business systems and user needs. Documents requirements, defines scope and objectives, and formulates systems to parallel overall business strategies. May require a bachelor’s degree in a related area and 4-6 years of experience in the field or in a related area. Familiar with relational database concepts, and client-server concepts. Relies on experience and judgment to plan and accomplish goals. Performs a variety of complicated tasks. May lead and direct the work of others. A wide degree of creativity and latitude is expected. Typically reports to a manager.

CLIENT-SERVER TABLEAU DEVELOPER (1 YEAR CONTRACT)

Reviews, analyzes, and modifies programming systems including encoding, testing, debugging and installing to support an organization’s client/server software applications. May require a bachelor’s degree in a related area and 4-6 years of experience in the field or in a related area. Familiar with relational database concepts, and client-server concepts. Relies on experience and judgment to plan and accomplish goals. Performs a variety of complicated tasks. May lead and direct the work of others. Typically reports to a project leader or manager. A wide degree of creativity and latitude is expected. Specialty in Tableau dashboards/reporting.

Applied Excel and Analysis Services e-Learning Course Available

BI solutions typically include a semantic layer. In Microsoft BI, the role of a semantic layer is fulfilled by Multidimensional cubes or Tabular models, whose virtues I extolled in this newsletter. If you invested in an SSAS model already, congratulations! You’ve done the lion’s share. But as you know, the next step is to train your business users and get them all excited about BI. This is not a simple task. And, if you plan to use Excel to offload reporting effort, the task is even more difficult because Excel is packed with BI features. This is why I put together a recorded e-learning “Applied Excel and Analysis Services” class. Having more than 5 hours of video content, the class sells for only $120 per student. And, if you use coupon PROLOGIKA-EXCEL-1 by end of October, you can get it for only $90.

To BI managers and BI developers: You’ve implemented an organizational Analysis Service model. Now you need to choose a tool for interactive data analytics and train your users. As you know, there is a proliferation of Business Intelligence tools on the market and each claims to solve your challenges. But the chances are that you already have what you need – Microsoft Excel. And, as far as the documentation goes, who has time to document all Excel BI features and demo them to users? I designed this class to help you empower your users and get them excited about BI with Excel and Power Pivot.

To business users: If your organization have Analysis Services Multidimensional cubes or Tabular models and you want to gain valuable insights from them, then this course is for you. Designed as a step-by-step tour, this course teaches you how to become a data analyst and unlock the hidden power of data. You’ll learn how to apply the Excel desktop BI capabilities to create versatile reports and dashboards for historical and trend analysis. You’ll learn also how to share your BI artifacts across the organization by publishing them to SharePoint. “I never knew Excel can do this” is the most common feedback we hear from our students.

The class curriculum and promo video is also available on the Prologika website.

Enjoy!

Optimizing Distinct Count Excel Reports

I wonder how many people believe that Tabular DistinctCount outperforms Multidimensional judging by Excel reports alone. In this case, an insurance company reported a performance degradation with Excel reports connected to a multidimensional cube. One report was taking over three minutes to run and it was requesting multiple fields on rows (insured, insured state, insured city, policy number, policy year, underwriter, and a few more) and about a dozen measures, including several distinct count measures, such as claim count, open claim count, and so on. The report would only need subtotals on three of the fields added to the ROWS zone. The cube had about 20 GB a disk footprint so the data size is not the issue here. The real issue is the crappy MDX queries that Excel auto-generates because they are asking for subtotals for all fields added to ROWS, using the following pattern:

NON EMPTY CrossJoin(CrossJoin(CrossJoin(CrossJoin(CrossJoin(CrossJoin(CrossJoin(CrossJoin(

Hierarchize({DrilldownLevel({[Insured].[Insured Name].[All]},,,INCLUDE_CALC_MEMBERS)}),

Hierarchize({DrilldownLevel({[Insured].[Insured City].[All]},,,INCLUDE_CALC_MEMBERS)})),

Hierarchize({DrilldownLevel({[Insured].[Insured State].[All]},,,INCLUDE_CALC_MEMBERS)})),

Hierarchize({DrilldownLevel({[Policy Effective Date].[Year].[All]},,,INCLUDE_CALC_MEMBERS)})),

Hierarchize({DrilldownLevel({[Policy].[Natural Policy Key].[All]},,,INCLUDE_CALC_MEMBERS)})),…

As you can see, the query requests the ALL member of the hierarchy. By contrast, a smarter MDX query generator would request subtotals on the fields that need subtotals only. For example, a rewritten by hand query executes within milliseconds following this pattern:

Hierarchize({DrilldownLevel({[Insured].[Insured Name].[All]},,,INCLUDE_CALC_MEMBERS)}) *

Hierarchize({DrilldownLevel({[Insured].[Insured City].[Insured City].Members},,,INCLUDE_CALC_MEMBERS)})) *

Hierarchize({DrilldownLevel({[Insured].[Insured State].[Insured State].Members},,,INCLUDE_CALC_MEMBERS)}))…

But we can’t change the queries Excel generates and we are at the mercy of the MDX query generator. And, the more fields the report requests, the slower the query would be. DistinctCount measures aggravate the issue further. The problem is that the DC measures cannot be aggregated from caches at deeper levels. Therefore, increasing the number of granularities in the query increases the number of subcubes that are requested from the storage engine, and they’re not going to hit earlier subcubes unless they match at the exact granularity – which is unlikely when the query results are not cached. And at some point, the doubled subcube count will trigger the query degradation (you will see many “Getting data from partition” events in the Profiler). Many of these subcubes are really needed, but some of them are generated for subtotals that Excel doesn’t really need.

I actually logged this issue more than three years ago but the Office team didn’t bother. The original bug was with Power Pivot but the issue was the same. To Microsoft’s credit, the SSAS team introduced an undocumented and unsupported PreferredQueryPatterns setting for both Multidimensional and Tabular, which can be set in msmdsrv.ini (ConfigurationSettings\OLAP\Query\PreferredQueryPatterns). I don’t think it can be set in the connection string. Excel discovers when PreferredQueryPatterns is set to 1 and generates different (drilldown) query pattern instead of the original (crossjoin) pattern. Unfortunately, it looks like more work and testing were done on the Tabular side of things where PreferredQueryPatterns is actually set by default to 1 (although you won’t see it in msmdsrv.ini). I tried a Tabular version of the customer’s cube (only a subset of tables loaded with the biggest table about 50 mil rows fact snapshot and a few distinct count measures) to test with similar Excel queries. With the default configuration (PreferredQueryPatterns=1), Tabular outperformed MD by far (queries take about 3-5 seconds). Initially, I thought that Tabular fares better because of its in-memory nature. Then, I changed PreferredQueryPatterns to 0 on the Tabular instance and reran the Tabular test to send queries with the crossjoin pattern. Much to my surprise, Tabular performed worse than the original MD queries.

PreferredQueryPatterns is 0 by default with Multidimensional due to concerns over possible performance regressions. Indeed, my tests with setting PreferredQueryPatterns to 1 on MD, caused ever-increasing memory utilization until the server ran out of memory so unfortunately it was unusable for this customer. If customer approves, I plan to log a support case. Ideally, the Office team should fix this by auto-generating more efficient MDX queries. If no help on that end, the SSAS team should make PreferredQueryPatterns work with MD. BTW, I was able to optimize somewhat the MD reports by using member properties instead of attributes (from 3 min query execution time went down to 1 min) but that was pretty much the end of the optimization path.

MVP for 11 Years

Microsoft awarded me again with the Most Valuable Professional (MVP) Award for SQL Server. This is an annual award given to selected individuals worldwide in recognition for their expertise and contribution to the community. This makes it 11 consecutive years for me as SQL MVP!

Atlanta MS BI Group Meeting on Sep 29th

Join us on Monday, September 29th for our meeting of Atlanta MS BI Group to learn about DAX – the programming language of Power Pivot and Tabular.

Presentation:DAX 101
 Level: Beginner
Date:Monday, September 29th, 2014
Time6:30 – 8:30 PM ET
Place:South Terraces Building (Auditorium Room)

115 Perimeter Center Place

Atlanta, GA 30346

Overview:In this session, we will look at the new BI query language for PowerPivot and Tabular – DAX. This session will give you an introduction to PowerPivot and Data Analysis eXpressions (DAX) and will provide you the necessary understanding to start using DAX in your environment for data analysis. No prior experience with DAX is needed to attend this session.
Speaker:Damu Venkatesan is a Business Intelligence Consultant with over 25 years of IT experience. His experience includes architecting solutions in Business Intelligence using SQL Server, SharePoint & data management. He is the founder of Healthcare SQL Virtual Chapter for PASS. He has successfully delivered several BI/DW solutions and data migrations to various clients in Healthcare, Financials and Government applications using Microsoft technologies. He is on the board of DAMA Georgia chapter.
Sponsor:TEK Systems

Investigating Deadlocks

Two different customers having deadlock issues. The first one is having deadlock issues happening during DML operations in an OLTP database. The second one – during ETL load of a data warehouse. First, what is a deadlock? Imagine that a friend and you go to a supermarket to buy beer and chips. You both go to the same aisle and you both attempt to pick the same pack of beer and the same bag of cheeps (in reality, two rows might be located in the same page so the locks might be more coarse). While you pick the pack of beer and reach out for the chips, your friend has already picked the same bag of chips and he’s reaching for your pack of beer. Neither of you want to let go. So, a deadlock is caused by two transactions attempting to lock two resources in the reverse order.

SQL Server has no way to resolve this situation but to terminate one of the transactions (usually the one that has done less work). It’s like the supermarket manager discovers the deadlock situation, figures out which customer entered second and sends him home empty handed. Terminating a customer is not good for business so I decided to use another metaphore. We can get more information about deadlocks by tracing the Deadlock Graph event in the SQL Profiler, such as to get this nice graph (I’ve noticed that when locks involved system processes, such as transactional replication, the graph is not so nice).

090814_0255_Investigati1

For more information about deadlocks and monitoring, read these two very informative blogs: How to Monitor Deadlocks in SQL Server and How to Track Down Deadlocks Using SQL Server 2005 Profiler. One thing that I want to add is that you can right-click the TextData column of the deadlock graph trace and save the payload as an XML file. Then, you can open the file in your favorite XML editor or Internet Explorer and see exactly which SQL statements are conflicting and which process was terminated.

After some investigation, it turned out that the deadlock issue for the first customer was caused by application transactions conflicting with triggers (recall that all operations in a trigger are executed under an implicit transaction). Interestingly, some of these trigger transactions were conflicting with a transactional replication that is replicating the tables from the OLTP server to a reporting database. The issue with the second customer is still under investigation but it looks like it’s caused by ETL processes trying to update a fact table at the same time possibly resulting in locking the same pages in reverse order. Here are some guidelines to avoid deadlocks:

  1. Revisit application transaction logic to make sure that tasks within transactions execute in the same order.
  2. Keep transactions short or don’t use transactions at all unless you absolutely must guarantee that the entire sequence of operations is undone if one operation fails. In many cases, it’s OK to let the first task succeed if a latter fails.
  3. Consider using NOLOCK to avoid locking when reading data. Try using the ROWLOCK hint for DML operations but watch for performance degradation when many rows are inserted. For parallel load into a partitioned table, change the table lock escalation ALTER TABLE … SET (LOCK_ESCALATION = AUTO). When loading a fact table, consider removing foreign keys on the large tables to avoid locking and speed up inserts
  4. Avoid triggers.
  5. When you inserted a batch of rows from different ETL packages into a fact table, carefully consider its clustered index. For example, if you choose to create the index on the DateKey column, all new rows will go into the end of the table, causing contention. One workaround could be to use a composite index, such as with two columns (LocationKey and DateKey) so inserts are spread out.


Atlanta MS BI Group Meeting on Aug 25th

Join us tonight for a knowledge-packed meeting of Atlanta MS BI Group to learn how to optimize and automate your ETL.

Presentation:Making your SSIS Fly Beyond the Sky
 Level: Intermediate to Advanced
Date:Monday, August 25th, 2014
Time6:30 – 8:30 PM ET
Place:South Terraces Building (Auditorium Room)

115 Perimeter Center Place

Atlanta, GA 30346

Overview:How fast can an ETL package be? How big of a dataset is too big causing us to wait several hours to load data? Do you know those properties that you never touched because you were afraid to break something else? Well, let’s try them. In this demo-rich presentation, we’ll focus on some 101 tips that will maximize your package throughput. We will also go deeper toward a 200-300 level, when we will walk through some very interesting database design patterns that will ultimately affect the performance of your SSIS.
Speaker:Carlos Rodrigues has more than 15 years of experience, and most of it with Business Intelligence. Adept in implementing state-of-art Business intelligence and Data warehouse solutions using the entire Microsoft BI toolset, he currently manages onsite, offshore and remote teams but he remains technical and hands-on, and up to date with new technologies. Carlos delivered a few presentations for the Atlanta BI Group and Atlanta SQL Saturday. He follows Ralph Kimball’s school of thought.
Sponsor:Halo BI is dedicated to the simple principle that data is dumb; it’s people who provide the intelligence. No software package, no matter how fast it collects, processes or displays data, will ever deliver “business intelligence”. We are about developing technology to enable real business intelligence — the human kind.

Where is SSDT?

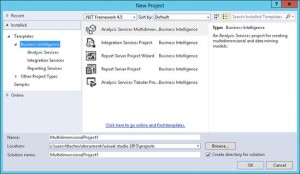
Now that Microsoft has decoupled SQL Server Data Tools from the SQL Server 2014 setup, the quest to find SSDT has started. You can download SSDT from the Microsoft SQL Server Data Tools page. Note that to get the BI project templates, you need the SSDT-BI install depending on the Visual Studio version you have (scroll all the way down the page to see the SSDT-BI links). If you don’t have Visual Studio installed (you probably don’t need it if you don’t code), I suggest you pick the latest, which as of this writing is Download SSDT-BI for Visual Studio 2013.

To make things a bit more interesting, Microsoft threw in another gotcha. When you run the SSDT setup, it will ask you if you want to install a new instance of SQL Server or add features to the existing instance. If you have SQL Server already installed, you might opt to add features to the current instance but you’ll be greeted later on with a rule violation “The CPU architecture of installing feature(s) is different than the instance specified. To continue, add features to this instance with the same architecture.” I have no idea what’s complaining about here given that when I tried this I had a brand new instance of SQL Server 2014 installed. It looks like we have a bug report on this already.

Although it doesn’t make much sense, the correct choice is to create a new instance although the setup won’t be creating any new instances since we are installing only SSDT here. After the install, you can start SSDT and see the beloved BI project templates.

1856.ssdt.jpg-550x0

SSRS Style Templates

As you probably know, the SSRS Report Wizard allows users to select predefined report styles. These styles are basic “skins” that apply to report foreground and background colors.

3124.styles.jpg-550x0

A question came in from a student as to how to modify/add styles. You can alter the existing style templates or add new ones by editing the StyleTemplates.xml file in the \Program Files (x86)\Microsoft Visual Studio 10.0\Common7\IDE\PrivateAssemblies\Business Intelligence Wizards\Reports\Styles\<language> folder. You need to make this change on the client machine where SSDT is installed.

On the subject of styles, recall that starting with SQL Server 2008 R2, SSRS supports report parts to promote report reuse and reduce maintenance.

Absolute Tabular KPIs

An interesting requirement popped up during an Analysis Services class I’m teaching this week. The customer wants to implement a Tabular/PowerPivot KPI that has this pseudo logic:

CASE

WHEN Actual Below Goal && Below LastYearSales Then Red

WHEN Actual Below Goal && Above LastYearSales Then Yellow

WHEN Actual >= Goal Then Green

END


Although I’m using Tabular, the same calculations will work with Power Pivot.

  1. Define a LastYearSales measure using the following formula assuming that the measure for the actual amount will be ResellerSales[SalesAmount]
    =CALCULATE(SUM(ResellerSales[SalesAmount]), PREVIOUSYEAR(‘Date'[Date]))
  2. Define a measure for the KPI actual value using the formula:

=SWITCH(TRUE(),

SUM(ResellerSales[SalesAmount])<Sum(SalesQuotas[SalesAmountQuota]) && SUM(ResellerSales[SalesAmount])<[LastYearSales],-1,

SUM(ResellerSales[SalesAmount])<Sum(SalesQuotas[SalesAmountQuota]) && SUM(ResellerSales[SalesAmount])>[LastYearSales],0,

SUM(ResellerSales[SalesAmount])>=Sum(SalesQuotas[SalesAmountQuota]),1

)

This measure using the DAX Switch function. However, to use it as a searched case expression, we use a trick where first argument returns TRUE and the rest of the conditions are evaluated against this hardcoded Boolean value. The formula normalizes the status as -1 (Red), 0 (Yellow), and 1 (Green).

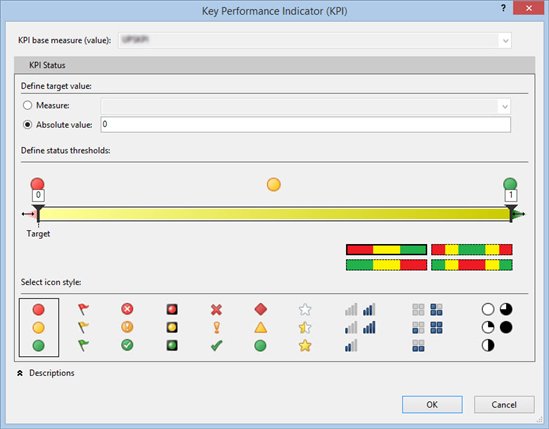
  1. Define the KPI. Notice that the KPI uses an absolute value of 0 for the target.

    7356.kpi.jpg-550x0

    TIP: If you use Tabular, instead of using the UI you can open the BIM file source code, locate the _KPI Status measure and modify it as follows:

    CREATE MEASURE ‘ResellerSales'[KPI]=SWITCH(TRUE(),
    SUM(ResellerSales[SalesAmount])&lt;Sum(SalesQuotas[SalesAmountQuota]) &amp;&amp; SUM(ResellerSales[SalesAmount])&lt;[LastYearSales],-1,
    SUM(ResellerSales[SalesAmount])&lt;Sum(SalesQuotas[SalesAmountQuota]) &amp;&amp; SUM(ResellerSales[SalesAmount])&gt;[LastYearSales],0,
    SUM(ResellerSales[SalesAmount])&gt;=Sum(SalesQuotas[SalesAmountQuota]),1
    );
    CREATE MEASURE ‘ResellerSales'[_KPI Goal] = 0;
    CREATE MEASURE ‘ResellerSales'[_KPI Status] = if(ISBLANK(‘ResellerSales'[KPI]),BLANK(),
    If(‘ResellerSales'[KPI]&lt;0,-1,
         If(‘ResellerSales'[KPI]&lt;1,0,1)
    );