We had the pleasure to have some 70 people attending our January 30th, 2012 meeting of the Atlanta BI group. Our sponsor, Matrix Resources, was kind enough to give us the auditorium. FisionIO sponsored the meeting. Phil Per-Lee did us a “Prototypes with Pizza” presentation, titled Connecting the Dots. And, Carlos Rodrigues rocked the stage with the main presentation about dimensional modeling.
I’ve uploaded pictures to the Photo Gallery section of our website and the slides to the Resources section. We’ve got some cool presentations lined up for next few months. Check our Calendar section to see what’s coming.
https://prologika.com/wp-content/uploads/2016/01/logo.png00Prologika - Teo Lachevhttps://prologika.com/wp-content/uploads/2016/01/logo.pngPrologika - Teo Lachev2012-02-01 01:16:002016-02-16 09:10:27Record Attendance for Atlanta BI Group Last Night
I had to download many ASP.NET pages from the SharePoint Pages library that were used to wrap up the Reporting Services ReportViewer webpart. I wanted the pages as files, so I could deploy them to another SharePoint server. Unfortunately, SharePoint doesn’t support selecting and downloading multiple files. But, it does support the WebDAV protocol.
Open Windows Explorer and type in the following URL:
\\<SharePoint site>\<library>
Example: \\elitex\Pages, where elitex is the SharePoint server and Pages is the document library.
Windows Explorer shows all documents in the library. From there on, just copy the files you need to another folder.
The only caveat is that you need to make sure the WebClient Windows service is running on your laptop. If you’re trying to connect from Windows 2008 Server, then make sure the Desktop Experience role is installed as well, which installs that WebClient service.
https://prologika.com/wp-content/uploads/2016/01/logo.png00Prologika - Teo Lachevhttps://prologika.com/wp-content/uploads/2016/01/logo.pngPrologika - Teo Lachev2012-01-19 15:06:572021-02-16 03:48:49Downloading Multiple Files from SharePoint using WebDav
As you probably now, Reporting Services doesn’t allow you to create subscriptions with data sources that use Windows security because subsbscriptions are run in unattended mode. Moving to SQL Server 2012, we’ll add Data Alerts to the list. This presents an issue if you use Analysis Services which only supports Windows security. The only option is to use Stored Credentials with the “Use as Windows credentials” checkbox checked. You won’t able to pass the user identity by checking “Set execution context to this account”. As with previous releases, “Set execution context to this account” works with the SQL Server data but it doesn’t work with the Analysis Services provider.
I raised this issue to Microsoft and I posted a bug report. The issue is under investigation but it’s unlikely to get fixed before SQL Server 2012 ships. Please vote!
https://prologika.com/wp-content/uploads/2016/01/logo.png00Prologika - Teo Lachevhttps://prologika.com/wp-content/uploads/2016/01/logo.pngPrologika - Teo Lachev2012-01-17 13:08:002016-02-16 09:12:01Subscription and Alerts Issues with Analysis Services in SQL Server 2012
As 2011 is winding down, it’s time to reflect on the past and plan for the future. 2011 has been a very exciting year for Microsoft BI and me.
Gartner positioned Microsoft as a leader in the 2011 Magic Quadrant for Business Intelligence Platforms.
Although SQL Server 2012 will technically ship early next year, we can say it’s a done deal as it’s currently in a release candidate phase. The most important news from a BI perspective is the evolution of the Business Intelligence Semantic Model (BISM), which an umbrella name for both Multidimensional and Tabular models.
The Tabular model provides us with a nice personal (PowerPivot for Excel)-team (PowerPivot for SharePoint)-organizational (Analysis Services Tabular) continuum on a single platform.
Power View extends the BI reporting toolset with a sleek web-based reporting tool for authoring highly interactive and presentation-ready reports.
In its second release, Master Data Services (MDS) comes out of age and now allows end users to use Excel to manage master data. The newcomer, Data Quality Services (DQS), complements MDS nicely in the never-ending pursuit for clean and trusted data. Integration Services has also nice enhancements. Finally, columnstore indexes will help to aggregate large datasets, such as the scenario I mentioned in this blog.
Looking forward to 2012 and beyond, here is my top 5 BI wish list:
Extending the Tabular capabilities with more professional features, such as scope assignments, role-playing dimensions, MDX query support, and so on, to enhance its reach further in the corporate space. Ideally, I expect at some point in future unification of Multidimensional and Tabular so BI pros don’t have to choose a model.
Extending Power View to support multidimensional cubes. Further, in the reporting area, I expect an embeddable web-based OLAP browser (it’s time for Dundas Chart to come back to live) and an improved MDX query designer (no, I haven’t lost hope for this one).
Enhanced Excel BI capabilities so Excel becomes the BI tool of choice. This includes supporting PowerPivot natively and overhauling the reporting capabilities beyond the venerable PivotTable and PivotChart. Ideally, what I am hoping for is decoupling Power View from SharePoint and integrating it with Excel and custom web applications. Power View is too cool to be confined onlyin SharePoint.
Extending Microsoft Azure with BI capabilities to let solution providers host BI models in the cloud.
Bringing BI to mobile devices.
On the personal side of things, I’ve been fortunate to stay healthy and busy (very busy). The Atlanta BI group, which I am leading, has grown in size and we now enjoy having 40-50 people attending our monthly meetings. For the past few months, I’ve been working on my next book, Applied Microsoft SQL Server 2012 Analysis Services (Tabular Modeling), which I expect to get published in March. And, my consulting business has been great!
I wish you a healthy and prosperous year! I hope to meet many of you in 2012. Meanwhile, you can find me online at the usual places: www.prologika.com | blog | linkedin | twitter.
Happy New Year!
https://prologika.com/wp-content/uploads/2016/01/logo.png00Prologika - Teo Lachevhttps://prologika.com/wp-content/uploads/2016/01/logo.pngPrologika - Teo Lachev2011-12-31 23:08:002021-02-16 03:48:47Happy New Year 2012!
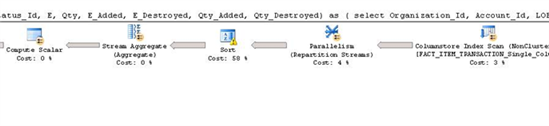
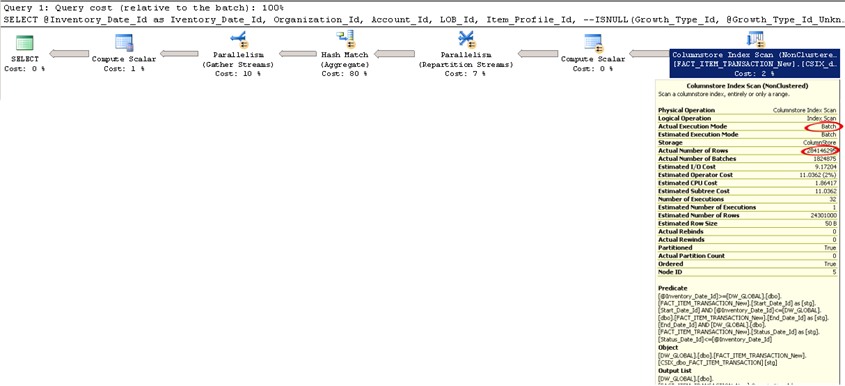
As I mentioned in my blog post on this subject, I’ve found a good use of SQL Server 2012 columnstore indexes to speed up significantly ETL processes that need to aggregate large datasets. But we run into a snag, which got promoted to a bug by Microsoft Support Services. Under some conditions, SQL Server would create a plan that uses a “stream aggregate” operator instead of the more efficient hash match aggregate. This is illustrated by the following plans.
This plan uses the stream aggregate and the query is much slower. If you hover on the Sort predicate, you will see a warning that the sort will spill data to tempdb.
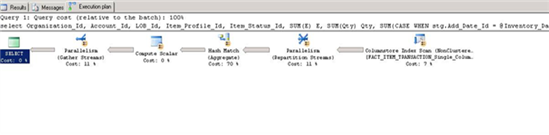
By contrast, this plan uses the Hash Match predicate and the query is about three times faster.
As I mentioned, this appears to be a bug with SQL Server 2012, which might not get fixed in RTM. Meanwhile, force your queries to use the HASH GROUP query hint to force SQL Server to use a hash match with columnstore indexes.
GROUP BYOrganization_Id,
Item_Profile_Id,
…
OPTION (HASHGROUP)
https://prologika.com/wp-content/uploads/2016/01/logo.png00Prologika - Teo Lachevhttps://prologika.com/wp-content/uploads/2016/01/logo.pngPrologika - Teo Lachev2011-12-21 03:52:002016-02-16 09:33:35Using the Hash Group Hint to Speed up ColumnStore Indexes
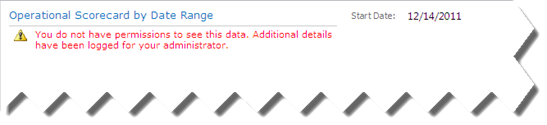
Issue: Migrate a PerformancePoint dashboard from MOSS 2007 to SharePoint 2010. We used the Import PerformancePoint Content feature to import existing dashboards from the PerformancePoint database and this saved us a lot of effort. However, filters failed with this rather obscure error:
After tracing with SQL Profiler and looking at the Windows Event log, we saw the following almost as useless error):
Microsoft.AnalysisServices.AdomdClient.AdomdErrorResponseException: Query (1, 7) Parser: The syntax for ‘{‘ is incorrect.
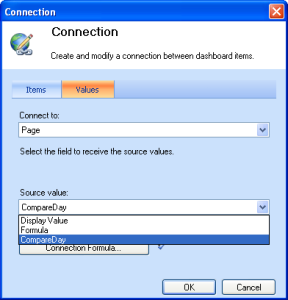
In this case, the dashboard is using a Time Intelligence filter mapped to an Analysis Services dimension.
Resolution: The upgrade process has mapped the filter’s formula in the connection to the scorecard. We fixed the issue by mapping the filter data source (not formula), as shown in the screenshot below. In this case, the CompareDay is the data source name.
SQL Server 2012 introduces columnstore indexes. Using the same in-memory VertiPaq engine that powers PowerPivot and Analysis Services Tabular, columnstore indexes can speed up dramatically SQL queries that aggregate large datasets. For a great introduction to columnstore indexes, see the video presentation, “Columnstore Indexes Unveiled” by Eric Hanson. I personally don’t see columnstore indexes as a replacement of Analysis Services because an analytical layer has much more to offer than just better performance. However, in a recent project we’ve found a great use of columnstore indexes to speed up ETL processes.
Issue: Perform an initial load of a snapshot fact table for inventory analysis from another fact table with one billion rows. For each day, extract some 200 million rows from the source fact table and group these rows into a resulting set of about 300,000 rows to load the snapshot fact table for that day. The initial estimates indicated that that the extraction query alone takes about 15 minutes when using a clustered index. And, that’s just for one day. Given this speed, we estimated the initial load could take weeks.
Solution: We upgraded to SQL Server 2012 and created a columnstore index on selected columns from the source fact table. We excluded high-cardinality columns that were not used by the extraction query to reduce the size of the index. Creating the index on the source table (1 billion rows) took about 10 minutes and this is very impressive. The disk footprint of the index was about 4GB. We ran the same extraction query and saw a five-fold performance improvement. This query, which would previously run for 15 minutes with a B-tree clustered index, would now finish in 3 minutes with a columnstore index.
When testing your queries with columnstore indexes, it is important to make sure that the query executes in Batch mode. As you can see in the screenshot below, the query uses the columnstore index and the execution mode is Batch. If it says Row, the query performance degrades significantly. Watch Eric Hanson’s presentation to understand why this happens and possible workarounds.
When I did initial tests to test the columnstore index, I ran into a gotcha. I tested a simple “SELECT SUM(X) FROM TABLE” query to find that it executes in a Row mode and the query took about 2 minutes to finish. As usual, the first thing I try doesn’t work. As it turned out, currently a columnstore index doesn’t support batch mode with scalar aggregates. You need to rewrite the query with a GROUP BY as Eric Hanson explains this in more details in his blog, “Perform Scalar Aggregates and Still get the Benefit of Batch Processing”. This is rather unfortunate because every ad-hoc report starts with the end user dropping a measure and the report tool generating such queries.
When testing the performance gain, it’s useful to compare how the same query would perform without a columnstore index. Instead of having two tables or dropping the index, you could simply tell SQL Server to ignore the columnstore index, such as:
SELECT … FROM…WHERE…GROUP BY…
OPTION (IGNORE_NONCLUSTERED_COLUMNSTORE_INDEX)
To sum up, when you are pushing the envelope of traditional B-tree indexes and queries aggregate data, consider SQL Server 2012 columnstore indexes. The query optimizer would automatically favor a columnstore index when it makes sense to use it. Columnstore indexes require a read-only table but the cost of dropping and recreating them is not that high. Or, you could add them to speed up the initial DW load and drop them once the load completes.
I was just about to write a blog about the new features in the Release Candidate (RC) build of Power View and I saw that Robert had written a great blog already. It’s great to see the product coming along so nicely. Can’t wait to be able to use multidimensional cubes as data sources!
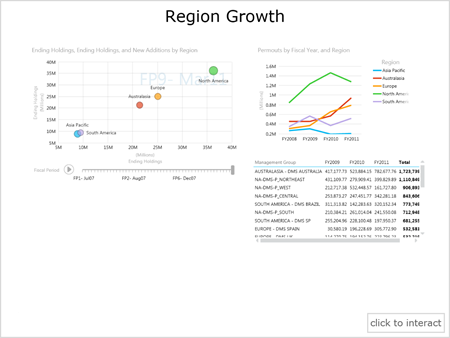
One feature that stirred a lot of excitement and deserves more attention is Power View export to PowerPoint. When you export a report to PowerPoint, initially you get static slides that show images of the report pages.
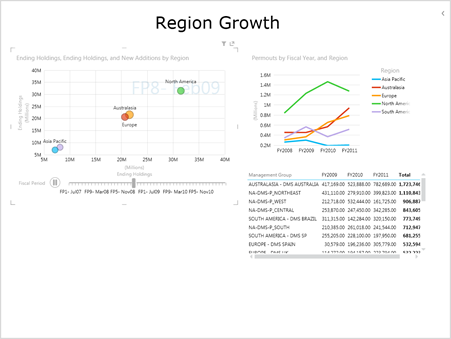
Don’t be fool however as you can click the Click to Interact button to render the report live. The interactive mode preserves all report interactive features. For example, in the screenshot below I am playing the scatter chart animation.
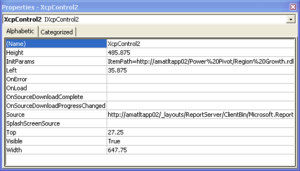
Behind the scenes, the interactive mode uses a Silverlight alternative hosting control (right-click the object on the slice and click View Code) that points to the deployed report on the SharePoint server. Therefore, a live connection and permissions to SharePoint are required to preview the report inside PowerPoint.
UPDATE 11/29/11
As explained in the SQL Server 2012 RC0 release notes, the pre-release bits of Silverlight 5 are not available in 64-bit. The RTM release will include a 64-bit installer and it looks like it be available pretty soon. Meanwhile, trying to interact with a Power View report exported to PowerPoint 64-bit wil fail with the error “Some controls on this presentation can’t be activated. They might not be registered on this computer.”
https://prologika.com/wp-content/uploads/2016/01/logo.png00Prologika - Teo Lachevhttps://prologika.com/wp-content/uploads/2016/01/logo.pngPrologika - Teo Lachev2011-11-23 01:29:002021-02-16 03:48:41What’s New in Power View RC0
The public release of Microsoft SQL Server 2012 RC0 is now available.
https://prologika.com/wp-content/uploads/2016/01/logo.png00Prologika - Teo Lachevhttps://prologika.com/wp-content/uploads/2016/01/logo.pngPrologika - Teo Lachev2011-11-18 13:06:262021-02-16 03:48:38SQL Server 2012 RC is Here