SharePoint is a like an ocean – the further you go, the deeper it gets
Ancient proverb
Scenario: Configure SQL Server 2012 Reporting Services on a multi-server SharePoint farm with the following topology:
WEB1 – Web front-end Server 1
WEB2 – Web front-end Server 2
APP1 – Application server 1 that hosts the Central Administration site
APP2 – Needs SSRS 2012
APP2 – Needs SSRS 2012
Issue: I couldn’t find the SQL Server Reporting Services Service Application option when I expanded the New button in Central Administration ð Manage Service Applications
Resolution: Although the SQL Server 2012 Reporting Services service and Reporting Services Add-in were installed on APP2 and APP3, the SQL Server Reporting Services service wasn’t registered at a farm level. As a result, I couldn’t find the SQL Server Reporting Services Service in Central Admin -> Manage Services on Server on none of the application servers. As it turned out, the SSRS service must be also registered on the application server hosting Central Administration (APP1 in my case) as Prash Shirolkar explains in his blog:
- Remote in to APP1.
- Install the Reporting Services add-in to get the SSRS PowerShell cmdlets. In my case, I installed only the add-in and not the Reporting Services service since I didn’t want it on APP1.
-
Run the SharePoint 2010 PowerShell as admin and execute the three commands in the Install and Start the Reporting Services SharePoint Service in the Install Reporting Services SharePoint Mode as a Single Server Farm
document:
- Install-SPRSService
- Install-SPRSServiceProxy
- get-spserviceinstance -all |where {$_.TypeName -like “SQL Server Reporting*”} | Start-SPServiceInstance
Interestingly, the first two commands don’t echo any output. The third command, however, should show you a message that the SSRS service has been provisioned. Now, you can go to Central Administration ð Manage Services on Server and you should be able to find the SQL Server Reporting Services Service. More importantly, you should be able to go to Central Administration ð Manage Service Applications, expand the New button and then click SQL Server Reporting Services Service Application to finalize the Reporting Services setup.
Possible alternative resolution path
Although I haven’t tried it because the client woudn’t allow farm configuration changes, another potential resolution path could be to temporarily switch the application server that hosts the Central Administration utility to one of the SSRS application server (APP2 or APP3) as explained in the blog post, “How to change Central Admin Host in SharePoint 2010” by Kirk Barrett. Then, you can register the SSSRS service on that server by executing the steps in item 3 above. Finally, switch back the Central Administration host server to the original server (APP1).
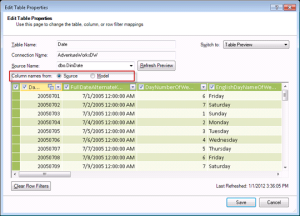
 I’ll be presenting “Personal BI with PowerPivot v2” for the Atlanta BI Group on Monday, February 27th. Join us to learn when personal BI makes sense and why PowerPivot is the best tool on the market when it does. The focus will be on the new features of PowerPivot version 2 which launch officially in a week or so.
 My new

