Got bit by an unfortunate bug which has been around for four years since it got reported on connect.microsoft.com with Analysis Services OLAP drillthrough. It caused me almost a day to figure out. Drillthrough actions (both default and explicit drillthrough) won’t return any rows on some cells or would return repeating rows for other cells. As I posted on connect the bug springs to action when:
The measure group has IgnoreUnrelatedDimensions=False. Bryan Smith provides a great coverage of IgnoreUnrelatedDimensions in this blog.
A dimension attribute has IsAggregatable set to False. Setting the dimension default member either using the DefaultMember attribute property or via script doesn’t make a difference.
In my case, I had a Time Calculations dimension which was a free floater and it had IsAggregatable=False. Excluding the unrelated dimensions from the drillthrough action doesn’t make a difference either. The only workaround I’ve found is to set IgnoreUnrelatedDimensions back to True. Vote for a due fix, please!
I was called upon to troubleshoot an issue with creating an aggregation design for an existing cube. The Design Aggregation Wizard would refuse to design aggregations with the following cryptic message:
Errors in the aggregation designer. The ‘Perspective’ dimension has no attribute for the aggregation design. The server cannot design aggregations when this attribute is missing.
Upon a closer look, it turned out the Perspective dimension joins the measure group via a many-to-many relationship. More importantly, its IsAggregatable property was set to False to suppress the All member because it would be meaningless to aggregate data across the members in this particular dimension. Instead, the cube script would set the dimension default member with an ALTER statement.
How do we solve this horrible problem? Here is my solution:
Set IsAggregatable property of the dimension attribute back to True.
Add a scope assignment to the cube script to nuke the All member. To be more specific, here we set the All member to null to take advantage of the fact that most browsers suppress empty cell and the All member won’t show up.
Root ([Perspective]) = null;
Design aggregations as usual.
Notice that I don’t remove the ALTER statement to assign a default member. If there is no default member, you would see that slicing by any other dimension other than Perspective would miraculously return no data, just like it would if no data exists in the cube. You must set up a default member if you remove or set the All member to null.
Now that the age of in-memory databases has dawned on us, I’ve been experimenting with different aspects of VertiPaq and I find its technology fascinating. It’s safe to say that VertiPaq will propel Microsoft Business Intelligence for years to come with all of its three flavors: PowerPivot (self-service BI), Business Intelligence Semantic Model (corporate BI), and data warehousing (column-based stored indexes). Unlike Analysis Services MOLAP, which compresses data by rows, VertiPaq compresses data by columns.
Column-based compression fits business intelligence like a glove because data is typically analyzed by columns. And, the lower the data cardinality (that is the more repeating values a column has), the higher its compression rate will be. Since most columns used for analytics fit this category, you could expect 10-15 times data compression. Consequently, a half terabyte database could potentially fit into 80 GB of memory. Notice that I account for more memory because when data is brought from disk into memory, additional space is needed to accommodate index tables and other structures. So, how is this not cool? Moving to BISM, all of your data could fit into memory so you could get a head start in performance just by having a superfast storage medium!
Continuing this line of thought, I decided to take the Contoso Retail DW database and a real-life data warehouse for a spin to see how VertiPaq compresses them. I used the excellent PowerShell script that Vidas Matelis developed. Since fact tables typically contribute to 95% of the data warehouse storage space, I focused on only one fact table from both databases. To measure the VertiPaq compression, I loaded the fact tables into PowerPivot and run the script to obtain their storage space.
MOLAP
VertiPaq
Contoso (FactSales)
129 MB
35 MB
DW (20 mil fact table)
810 MB
792 MB
As you can see, the Contoso VertiPaq results are very impressive. But what happened with the real-life DW? How could VertiPaq be only marginally better than MOLAP? To analyze this further, I used the script ability to get a column compression breakdown and I’ve noticed that the following top two columns occupy the most space:
TRANS_DTLS_KEY: 400 MB (primary key)
LOG_ID: 268 MB (transaction identifier)
Both of these columns are high-cardinality columns. I used these columns in a cube drillthrough action to get the transaction details behind a cell. Subsequently, I added them to PowerPivot so I could compare the same data structures. Currently, PowerPivot doesn’t support drillthrough so adding these columns to PowerPivot is probably not needed in real life. It will be interesting to see how BISM will implement drillthrough. One thing is sure: it makes sense to leave high-cardinality attributes out of VertiPaq and possibly use report actions (if supported) to report on details.
Now that a snow blizzard has paralyzed Atlanta for a week, what a better way to start the new year than sharing a PowerPivot success story. A bank institution has approached Prologika to help them implement a solution to report the customer’s credit history so the bank can evaluate the risk for granting the customer a loan. Their high-level initial requirements call for:
Flexible searching and filtering to the let the bank user find a particular customer or search for the customer accounts both owned by the bank or externally reported from other banks.
Flexible report layout that will let the bank user change the report layout by adding or removing fields.
Ability to download the report locally to allow the bank user to run the report when there is no connectivity.
Refreshing the credit history on a schedule.
Initially, the bank was gravitating toward a home-grown solution that would require tons of custom code to implement a desktop client that uses a third-party control or ReportViewer for reporting. One cool thing about Microsoft BI and my favorite tip I share at any public event is that reduces or eliminates custom code. This may sound strange coming from someone who spent most of his career writing code but less code is indeed in the customer’s best interest. So, we suggested a solution based on PowerPivot with the following implementation highlights:
Implement a PowerPiivot application and import the customer and account information.
Allow the end user to use slicers and PivotTable filters to search and filter data.
Upload to PowerPivot application to SharePoint to let each bank user view and interact with the report without requiring Excel 2010 installed locally.
Allow the user to download the application for offline reporting. This requires Excel 2010 with PowerPivot installed locally.
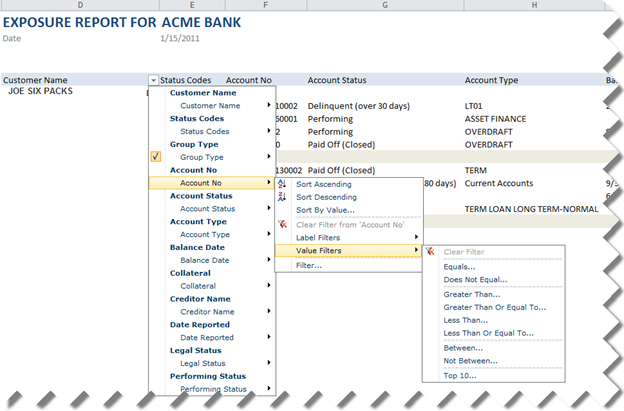
Here is a screenshot of the PowerPivot application rendered in SharePoint (sensitive information replaced to protect the innocent) that demonstrates some of the filtering capabilities that are built in Excel Services:
Needless to say, this PowerPivot-based solution saved our customer a lot of time and money. True, we had to make some tradeoffs in terms of functionality and flexibility. One interesting implementation detail was that the reporting requirements required detail-level reporting at the account level instead of aggregating data. Out initial thought was that the in-memory VertiPaq database could handle this very efficiently. However, we ran into performance issues related to the fact that Excel generates MDX queries against VertiPaq and MDX is not optimized for detailed-level reporting especially when cross-joining multiple dimensions. To mitigate this issue, we took advantage of the Analysis Services Autoexists behavior that cross-joins attributes of the same dimension very efficiently. To do so, we consolidated the Customer and Account information into the Accounts table. We used the Customer table only for the Excel slicers and filtering by customer.
Looking ahead, it will be nice if a future release of PowerPivot detects that it deals with VertiPaq and generates native DAX queries instead of MDX to take a full advantage of VertiPaq. Crescent will be the first and only Microsoft client when SQL 11 ships that will generate native queries so detailed-level reporting will likely to be faster with Crescent.
https://prologika.com/wp-content/uploads/2016/01/logo.png00Prologika - Teo Lachevhttps://prologika.com/wp-content/uploads/2016/01/logo.pngPrologika - Teo Lachev2011-01-15 18:05:312016-02-16 12:10:15PowerPivot Stories from the Trenches
A recommended practice for implementing time calculations in PowerPivot is to have a Data table with a datetime column. Kasper de Jonge explains in more details in this blog. This approach will probably save effort when importing data from normalized schemas and won’t require specifying additional arguments to the PowerPivot time functions. However, it will undoubtedly present an issue when importing data from a star schema. A dimensional modeling best practice is to have an integer key for a Data dimension table in the format YYYYMMDD and integer foreign keys in the fact tables. Luckily, you don’t have to normalize data back to datetime when building a PowerPivot model on top of star schemas after the issue with the All filter Kasper reported a while back got fixed in PowerPivot RTM.
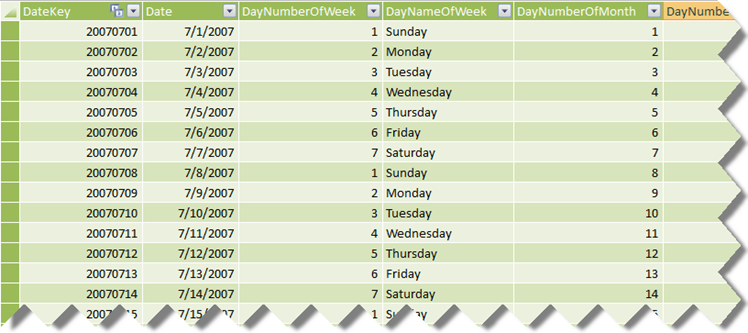
Let’s consider the AdventureWorksDW schema. Its DimDate table has an integer key (DateKey). Let’s say you import this table in PowerPivot and name it Date. This is what the resulting PowerPivot table may look like. Fact tables join the Data table on the DateKey field which is an integer key.
Now you want to calculate YTD values. Since we don’t have scope assignments in PowerPivot, you need to implement a time calculation for each field that you need YTD. For the SalesAmount field, you can use the following DAX expression:
The TotalYTD function is one of the PowerPivot time intelligence functions. The second argument references the Date column in the Date table which must be of datetime. Finally, the third argument overwrites the evaluation context by telling PowerPivot to evaluate the expression irrespective of date selection, that is across all dates. A nice enhancement for a future PowerPivot (aka BISM) release is to provide some sort of UI to allow the modeler to flag which column in the Data table is a datetime column in order to avoid the All flag.
Report actions are an Analysis Services extensibility mechanism that lets end users run a Reporting Services report as they browse the cube. A customer reported that they have trouble setting up a Reporting Services action for a report server configured in a SharePoint integrated mode – a scenario which appears that wasn’t tested properly by Microsoft.
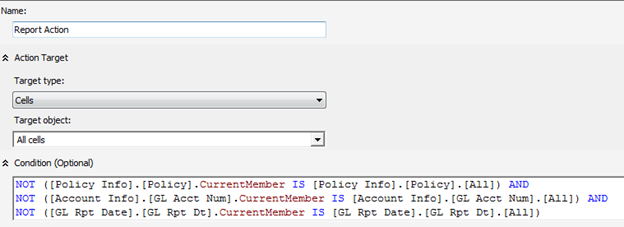
First, the customer wanted to pass multiple parameters to the report. This was achieved by setting up the report action Target Type to Cells and Target Object to All Cells. This setup allows the user to right-click any cell on the cube to initiate the action. What’s more important is that an action-capable browser, such an Excel, will be able to collect the coordinates of all dimensions used in the browser, such as those added to the filter area, so you can pass them as parameters to the report.
A condition is further specified to restrict the action. Because the cube browser will be passing three parameters to the report, the condition enables the action only if the corresponding members’ current member is not the All member.
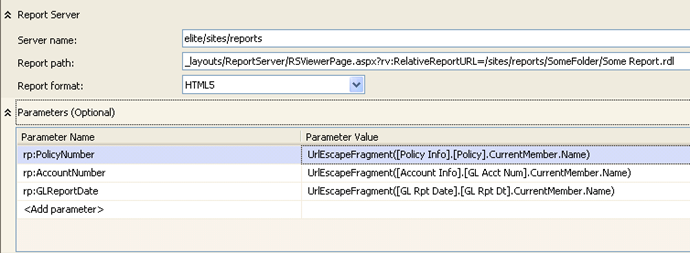
This is where things get interesting. You need to specify the server name and report path. Instead of pointing to the report server, you should point to the SharePoint library using the syntax that Prash Shirolkar from the Reporting Services explains in his blog. I haven’t tested this but I’d expect that if you reference the report server, the report will use the report definition copy on the report server and not the one stored in SharePoint. Recall that the latter is the master copy of the report definition and the one in the report server might be outdated. However, when you reference the SharePoint library, you’ll find that Analysis Services doesn’t prefix the parameters with rp:, which in turn makes the report server ignores the parameters. The ultimate hack is to prefix the parameters yourself:
Here, the server name is set to the SharePoint site URL. I’ve found that actually it doesn’t matter where you break the URL to server name and report path. SSAS will concatenate them, so I could have set the server name to elite only and moved the rest of the URL to the Report Path line. Also, notice that you don’t use http: as in http://elite/sites/reports. SSAS will add the protocol for you.
https://prologika.com/wp-content/uploads/2016/01/logo.png00Prologika - Teo Lachevhttps://prologika.com/wp-content/uploads/2016/01/logo.pngPrologika - Teo Lachev2010-12-12 02:39:002021-02-16 03:47:49Report Actions for Report Server in SharePoint Mode
Digital dashboards, also known as enterprise dashboards or executive dashboards, are rapidly rising in popularity as the presentation layer for business intelligence. The chances are that you’ve been asked to implement a dashboard to let management quickly ascertain the status (or “health”) of an organization via key business indicators (KPIs) and this task might seem daunting. This is where Dundas Dashboard can help.
As a leader in data visualization solutions, Dundas has given us great products that power many business intelligence solutions, including Microsoft Reporting Services and .NET charting. Its latest offering, Dundas Dashboard 2.5, lets you implement compelling dashboards quickly and easily. Since my career focus has been Microsoft Business Intelligence, I was curious to evaluate the capabilities of Dundas Dashboard and compare them with Microsoft PerformancePoint 2010.
Microsoft launched SQL Server 11 (Denali) pre-released forums and is eagerly awaiting your feedback. Judging by the number of BI-related forums, one can easily see that BI will be a big part of Denali with major enhancements across the entire BI stack. Of course, not many questions to ask if we don’t have the bits yet to play with (CTP1 doesn’t include the BI stuff) but still you can start probing Microsoft.
I dare to predict that in a few years after SQL 11 ships, there will be two kinds of BI professionals – those who know the Business Intelligence Semantic Model and those who will learn it soon. By the way, the same applies to SharePoint. What can you do to start on the path and prepare while waiting for BISM? Learn PowerPivot, of course, which is one of the three technologies that are powered by VertiPaq – the new column-oriented in-memory store. This is where the book PowerPivot for Excel 2010 can help. It’s written by Marco Russo and Alberto Ferrari, whose names should be familiar for those of you who have been following Microsoft BI for a while. Both authors are respected experts who have contributed a lot to the community. Stationed in Italy, they run the SQLBI website and share their knowledge via their blog and publications.
This is the second book that I’ve read about PowerPivot – after Professional Microsoft PowerPivot for Excel and SharePoint, which I reviewed in this blog. What I liked about this book is its deep coverage of Data Analysis Expressions (DAX). I specifically enjoyed the following chapters:
Chapter 6: Evaluation Context and CALCULATE – Provides a deep coverage of how DAX measures work. Although DAX is meant to be simpler than MDX, expressions can get complex and this chapter will help you understand how DAX works behind the hood.
Chapter 7: Date Calculations in DAX – Time calculations, such as YTD, QTD, are an important requirement for most BI projects. This chapter goes into details to explain how to implement them and provide workarounds for PowerPivot limitations.
Chapter 9: PowerPivot DAX Patterns – If you wonder whether PowerPivot can do this and that, read this chapter. It demonstrates advanced concepts ranging from ratio, percent of total, standard deviation, ranking over measures, Pareto computations, and more.
Chapter 10: PowerPivot Data Model Patterns – Another gem for addressing popular BI needs, such as banding, courier simulation, and many-to-many relationships.
Although not big in size (370 pages), you will find this book rich in patterns and solutions. What impressed me is that the authors put a great effort to cover not only the PowerPivot basics but to leave no stone unturned when the tool lacks in features. The authors discuss a requirement, approach it from different angles, and provide several implementation approaches. Thus, this book will benefit both beginners and advanced users. An indispensible resource for learning PowerPivot and giving a head start on BISM!
https://prologika.com/wp-content/uploads/2016/01/logo.png00Prologika - Teo Lachevhttps://prologika.com/wp-content/uploads/2016/01/logo.pngPrologika - Teo Lachev2010-11-25 02:59:002021-02-16 03:47:47Book Review – Microsoft PowerPivot for Excel 2010
 I dare to predict that in a few years after SQL 11 ships, there will be two kinds of BI professionals – those who know


