Prologika Newsletter Winter 2025

Diogenes holding a lantern

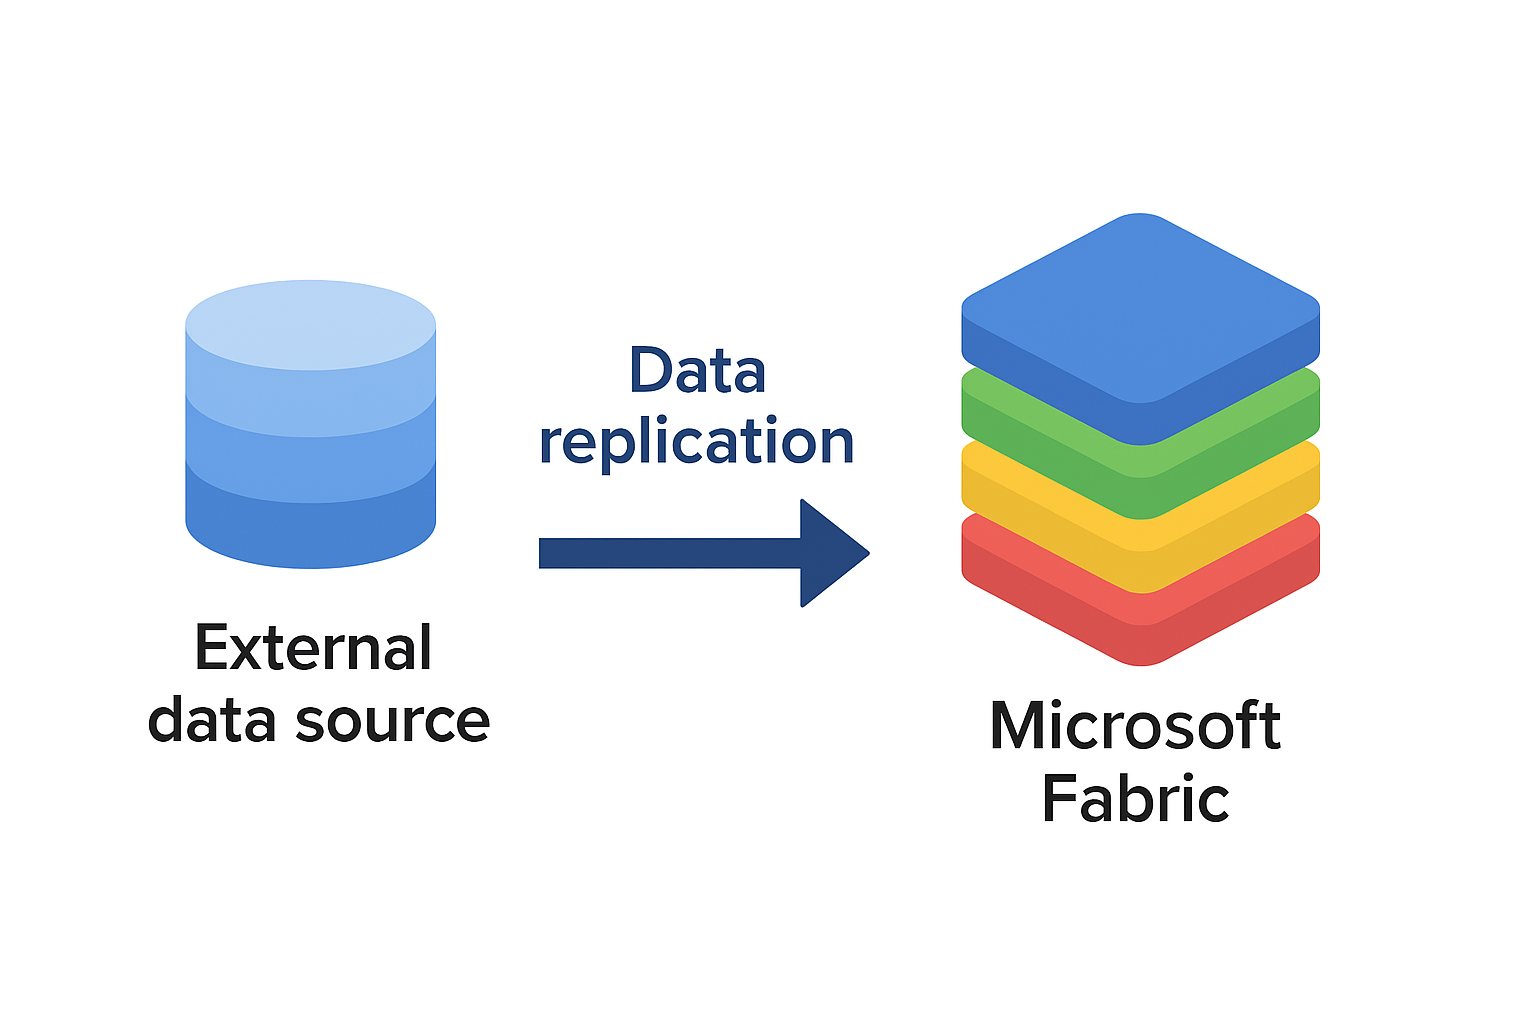
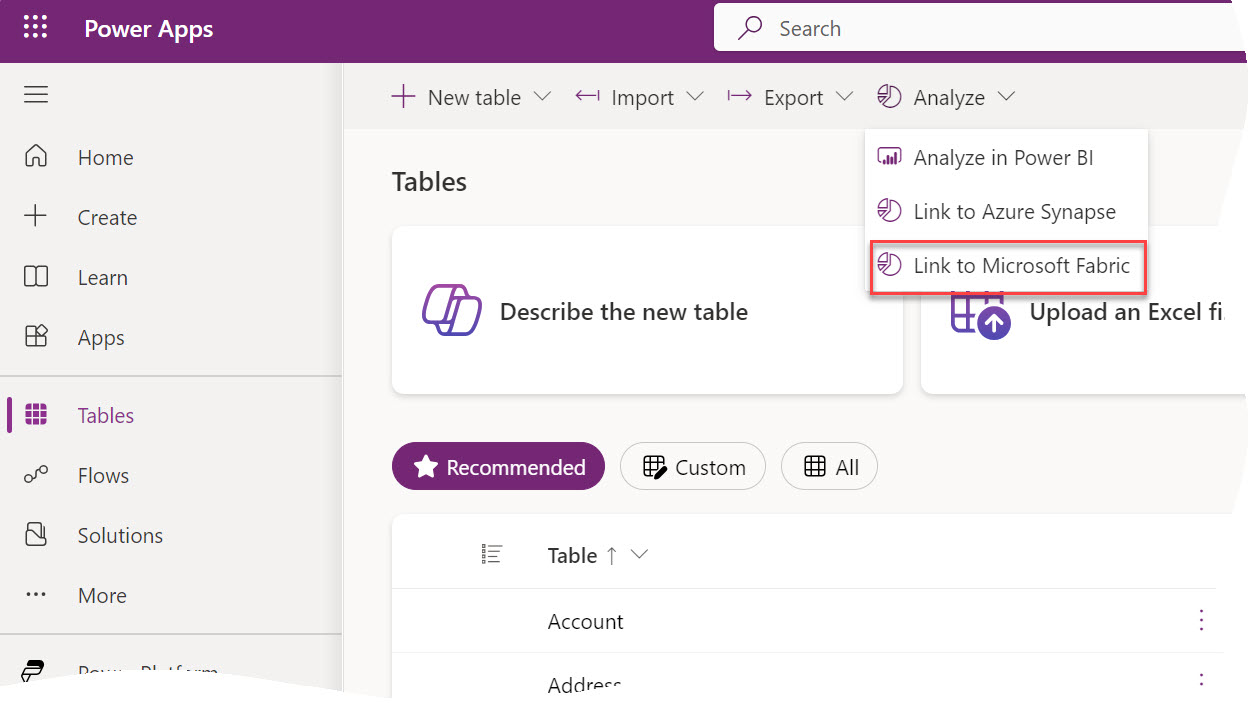
If Microsoft Fabric is in your future, you need to come up with a strategy to get your data in Fabric OneLake. That’s because the holy grail of Fabric is the Delta Parquet file format. The good news is that all Fabric data ingestion options (Dataflows Gen 2, pipelines, Copy Job and notebooks) support this format and the Microsoft V-Order extension that’s important for Direct Lake performance. Fabric also supports mirroring data from a growing list of data sources. This could be useful if your data is outside Fabric, such as EDW hosted in Google BigQuery, which is the scenario discussed in this newsletter.

Avoiding mirroring issues

A recent engagement required replicating some DW tables from Google BigQuery to a Fabric Lakehouse. We considered the Fabric mirroring feature for Google BigQuery (back then in private preview, now in public preview) and learned some lessons along the way:

1. 400 Error during replication configuration – Caused by attempting to use a read-only GBQ dataset that is linked to another GBQ dataset, but the link was broken.

2. Internal System Error – Again caused by GBQ linked datasets which are read-only. Fabric mirroring requires GBQ change history to be enabled on tables so that it can track changes and only mirror incremental changes after first initial load.

3. (Showstopper for this project) The two permissions that raised security red flags are bigquery.datasets.create and bigquery.jobs.create. To grant those permissions, you must assign one of these BigQuery roles:

• BigQuery Admin

• BigQuery Data Editor

• BigQuery Data Owner

• BigQuery Studio Admin

• BigQuery User

All these roles grant other permissions, and the client was cautious about data security. At the end, we end up using a nightly Fabric Copy Job to replicate the data.

Fabric Copy Job Pros and Cons

The client was overall pleased with the Fabric Copy Job.

Pros

  • 250 million rows replicated in 30-40 seconds!
  • You can have only one job to replicate all tables in Overwrite mode.
  • In the simplest case, you don’t need to create pipelines.

Cons

The Copy Job is work in progress and subject to various limitations.

  • No incremental extraction
  • You can’t mix different load options (Append and Overwrite) so you must split tables in separate jobs
  • No custom SQL SELECT when copying multiple tables
  • (Bug) Lost explicit column bindings when making changes
  • Cannot change the job’s JSON file
  • The user interface is clunky and it’s difficult to work with
  • No failure notification mechanism. As a workaround: add Copy Job to data pipeline or call it via REST API

Summary

In summary, the Fabric Google BigQuery built-in mirroring could be useful for real-time data replication. However, it relies on GBQ change history which requires certain permissions. Kudos to Microsoft for their excellent support during the private preview.


Teo Lachev
Prologika, LLC | Making Sense of Data
logo

Prologika Newsletter Fall 2025

Diogenes holding a lantern Like the Ancient Greek philosopher Diogenes, who walked the streets of Athens with a lamp to find one honest man, I have been searching for a convincing Fabric feature for my clients. As Microsoft Fabric evolves, more scenarios unfold. For example, Direct Lake storage mode could help you alleviate memory pressure with large semantic models in certain scenarios, as it did for one client. This newsletter summarizes the important takeaways from this project. If this sounds interesting and you are geographically close to Atlanta, I invite you to the December 1st meeting of the Atlanta MS BI Group where I’ll present the implementation details.

About the project

In this case, the client had a 40 GB semantic model with 250 million rows spread across two fact tables. The semantic model imported data from a Google BigQuery (GBQ) data warehouse. The client applied every trick in the book to optimize the model, but they’ve found themselves forced to upgrade from a Power BI F64 to F128 to F256 capacity.

I’ve written in the past about my frustration with Power BI/Fabric capacity resource limits. While the 25 GB RAM grant of a P1/F64 capacity for each dataset is generous for smaller semantic models, such as for self-service BI, it’s inadequate for large organizational semantic models. Ultimately, the developer must face gut wrenching decisions, such as whether to split the model into smaller semantic models to obey what are in my opinion artificially low and inflexible memory limits or ask for more money.

We’ve decided to replicate the GBQ data to a Fabric lakehouse and try Direct Lake to avoid the dataset refresh, which requires at least twice the memory. Granted, replicating data is an awkward solution, but currently Direct Lake requires data to be in Delta tables (Fabric Lakehouse, Data Warehouse, or shortcuts to Delta tables, such as in OneLake or Databricks).

Next, we migrated the largest semantic model from import to Direct Lake. You can find the technical details for the replication and migration steps we took in my blog “Migrating Fabric Import Semantic Models to Direct Lake”.

Performance considerations

The following screenshot is taken from the Fabric Capacity Metrics app and it shows the maximum metrics over 14 days. The two enclosed items of interest are the original imported semantic model (the first item on the list) and its DL counterpart (the seventh item on the list).

The Direct Lake memory utilization was at a par with the imported model. With 1/5 of the user audience testing the dataset in production environment, that dataset grew to a maximum of 25 GB memory utilization which is in line with the imported model. It could have been interesting to downgrade the capacity, such as to F64, and observe how the DL model would react to memory pressure. However, as shown in the screenshot, the client had other large semantic models that can exhaust the F64 25 memory grant so we couldn’t perform this test.

A screenshot of a computer AI-generated content may be incorrect.

Again, what we are saving here is the additional memory required for refreshing the model. In a sense, we shifted the model refresh to replicating the data from Google Big Query to a Fabric lakehouse. On the downside, an error during the replication process could leave the replicated tables in an inconsistent state (and user complaints because reports would show no data or stale data) whereas a failure during refreshing the model would fall back on the old model (Fabric builds a new in-memory cache during model refreshing).

We didn’t witness excessive CPU pressure during production testing. Further, the team didn’t notice any report performance degradation or increased CU capacity utilization.

Summary

Assuming you have exhausted traditional methods to alleviate memory pressure, such eliminating high-cardinality column, incremental refresh, etc., Direct Lake is a viable option to conserve memory of Fabric semantic models. However, it may require replicating your data to a Fabric lakehouse or migrating your data warehouse to Fabric so that it uses Fabric storage (Delta Parquet format) required for Direct Lake. If this is a new project and you expect large semantic models, your architecture should strongly consider Fabric Data Warehouse or Lakehouse to take advantage of Direct Lake storage.


Teo Lachev
Prologika, LLC | Making Sense of Data
logo

Prologika Newsletter Summer 2025

computer memory with queries executing and Microsoft Fabric logo. Image 4 of 4

The May release of Power BI Desktop added a feature called Translytical Task Flows which aims to augment Power BI reports with rudimentary writeback capabilities, such as to make corrections to data behind a report. Previously, one way to accomplish this was to integrate the report with Power Apps as I demonstrated a while back here. My claim to fame was that Microsoft liked this demo so much that it was running for years on big monitors in the local Microsoft office!

Are translytical flows a better way to implement report writeback? I followed the steps to test this feature and here are my thoughts.

The Good

I like that translytical flows don’t require external integration and additional licensing. By contrast, the Power Apps integration required implementing an app and incurring additional licensing cost.

I like that Microsoft is getting serious about report writeback and has extended Power BI Desktop with specific features to support it, such as action buttons, new slicers, and button-triggered report refresh.

I like that you can configure the action button to refresh the report after writeback so you can see immediately the changes (assuming DirectQuery or DirectLake semantic models). I tested the feature with a report connected to a published dataset and it works. Of course, if the model imports data, refreshing the report won’t show the latest.

The Bad

Currently, you must use the new button, text, or list slicers, which can only provide a single value to the writeback function. No validation, except if you use a list slicer. From end user experience, every modifiable field would need a separate textbox. This is horrible UI! Ideally, I’d like to see Microsoft extending the Table visual to allow editing in place.

Translytical flows require a Python function to propagate the changes. Although this opens new possibilities (you can do more things with custom code), what happened to low-code, no-code mantra?

The Ugly

Currently, the data can be written to only four destinations:

  • Fabric SQL DB (Azure SQL DB provisioned in Fabric)
  • Fabric Lakehouse
  • Fabric Warehouse
  • Fabric Mirrored DB

Notice the “Fabric” prefix in all four options? Customers will probably interpret this as another attempt to force them into Fabric. Not to mention that this imitation excludes 99% of real-life scenarios where the data is in other data sources. I surely hope Microsoft will open this feature to external data sources in future.

So, is the Power Apps integration for writeback obsolete? Not really because it is more flexible and provides better user experience at the expense of additional licensing cost.

In summary, as they stand today, transalytical task flows attempt to address basic writeback needs within Fabric, such as changing a limited number of report fields or performing massive updates on a single field. They are heavily dependent on Fabric and support writeback to only Fabric data sources. Keep an eye on this feature with the hope that it will evolve over time to something more useful.


Teo Lachev
Prologika, LLC | Making Sense of Data
logo

Prologika Newsletter Spring 2025

computer memory with queries executing and Microsoft Fabric logo. Image 4 of 4
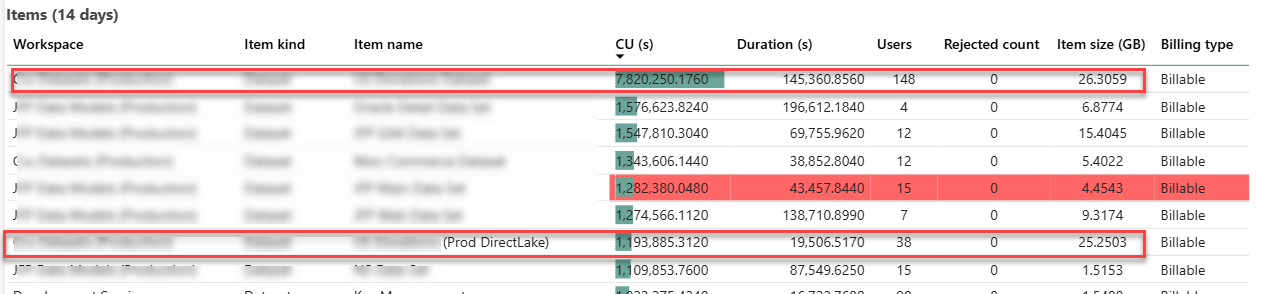
Looking for easy ways to create intelligent bots or Retrieval-Augmented Generation (RAG) apps? Microsoft Copilot Studio should help. After a year of letting it (and other Microsoft LLM offerings) simmer and inspired by the latest hoopla from the Ignite conference, I took another look at Microsoft Copilot Studio and share my findings in this newsletter. For the uninitiated, Copilot Studio lets you implement AI-powered smart bots (“agents”) for deriving knowledge from documents or websites. Basically, you can view the relationship of Copilot Studio to Retrieval-augmented Generation apps as what Power BI is to self-service BI.


Copilot Studio licensing starts at $200 per month for up to 25,000 messages (interactions between user and agent) although at Ignite Microsoft hinted that pay-as-you-go licensing will be coming.

The Good

A few months ago, when I discussed RAG apps, it was obvious that a lot of custom code had to be written to glue the services together and implement the user interface. Microsoft Copilot Studio has the potential to change and simplify this. It offers a Power Automate-like environment for no-code, low-code implementation of AI agents and therefore opens new possibilities for faster implementation of various and specialized AI agents across the enterprise. I was impressed by how easy the process was and how capable the tool was to create more complex topics, such as conditional branches based on user input.

Like Power BI, the tool gets additional appeal from its integration with the Microsoft ecosystem. For example, it can index SharePoint and OneDrive documents. It can integrate with Power Automate, Azure AI Search and Azure Open AI.

I was impressed by how easy is to use the tool to connect to and intelligently search an existing website. For now, I see this as being its main strength. Organizations can quickly implement agents to help their employees or external users to derive knowledge from intranet or Internet websites.

To demonstrate this, I implemented an agent to index my blog and embedded it below for you to try it out before my free trial expires. Please feel free to ask more sophisticated questions, such as “What’s the author’s sentiment toward Fabric?”, “What are the pros and cons of Fabric?”. Or “I need help with Power BI budget” (I got innovative here and implemented a conditional topic with branches depending on the budget you specify). I instructed the tool to stay only within the content of  my website, so the answers are not diluted from other public sources. Given that no custom code was written, Copilot Studio is pretty impressive.

The Bad

Everyone wants to be autonomous and AI agents are no exception. In fact, “autonomous agent” is the buzzword of AI world today. Not to be outdone, Copilot Studio claims that it can “build agents that operate independently to dynamically plan, learn, and escalate on your behalf”. However, as the tool stands today, I don’t think there is much to this claim. Or it could be that my definition of “autonomous” is different than Microsoft’s.

To me, an autonomous agent must be capable of making decisions and taking actions on its own. Like you tell your assistant that you plan a trip, give her some constraints, such as how much to spend on hotel and air, and let her make travel reservations. As it stands, Copilot Studio offers none of this. It follows a workflow you specify. Again, its output is more or less a smarter bot than the ones you see on many websites.

However, at Ignite Microsoft claimed that autonomy is coming so it will be interesting to see how the tool will evolve. Don’t get me wrong. Even as it stands, I believe the tool has enormous potential for more intelligent search and retrieval of information.

The Ugly

My basic complaint as of now is performance. It took the tool 10 minutes to index a PDF document. Then in a momentary lapse of reason, I connected it to an Azure SQL Database with Adventure Works with 15 tables (the max number of tables currently supported) and it’s still not done indexing after a day. Given that many AI implementations would require searching the data in relational databases, this is not acceptable. Not to mention there isn’t much insight on how far it’s done indexing or limit the number of fields it should index.

Therefore, I believe most real-world architectures for implementing AI agents will take the path Copilot Studio->Azure AI Search ->Azure Open AI, where Copilot Studio is used for implementing the UI and workflows (topics and actions), while the data indexing is done by Azure AI Search with semantic ranking in conjunction with Azure Open AI for embedded vectors.


Teo Lachev
Prologika, LLC | Making Sense of Data
logo

Prologika Newsletter Winter 2024

computer memory with queries executing and Microsoft Fabric logo. Image 4 of 4I conducted recently an assessment for a client facing memory pressure in Power BI Premium. You know these pesky out of memory errors when refreshing a biggish dataset. They started with P1, moved to P2, and now are on P3 but still more memory is needed to satisfy the memory appetite of full refresh. The runtime memory footprint of the problematic semantic model with imported data is 45 GB and they’ve done their best to optimize it. This newsletter outlines a few strategies to tackle excessive memory consumption with large semantic models. Unfortunately, given the current state of Power BI boxed capacities, no option is perfect and at end a compromise will probably be needed somewhere between latency and performance.

Why I don’t like Premium licensing

Since its beginning, Power BI Pro per-user licensing (and later Premium Per User (PPU) licensing) has been very attractive. Many organizations with a limited number of report users flocked to Power BI to save cost. However, organizations with more BI consumers gravitated toward premium licensing where they could have unlimited number of report readers against a fixed monthly fee starting at listed price of $5,000/mo for P1. Sounds like a great deal, right?

I must admit that I detest the premium licensing model because it boxes into certain resource constraints, such as 8 backend cores and 25 GB RAM for P1. There are no custom configurations to let you balance between compute and memory needs. And while there is an auto-scale compute model, it’s very coarse and it applies only to processing cores. The memory constraints are especially problematic given that imported models are memory resident and require more than twice the memory for full refresh. From the outside, these memory constraints seem artificially low to force clients into perpetual upgrades. The new Fabric F capacities that supersede the P plans are even more expensive, justifying the price increase with the added flexibility to pause the capacity which is often impractical.

It looks to me that the premium licensing is pretty good deal for Microsoft. Outgrown 25 GB of RAM in P1? Time to shelve another 5K per month for 25 GB more even if you don’t need more compute power. Meanwhile, the price of 32GB of RAM is less than $100 and falling.

It will be great if at some point Power BI introduces custom capacities. Even better, how about auto-scaling where the capacity resources (both memory and CPU) scale up and down on demand within minutes, such as adding more memory during refresh and reducing the memory when the refresh is over?

Strategies to combat out-of-memory scenarios

So, what should you do if you are strapped for cash? Consider evaluating and adopting one or more of the following memory saving techniques, including:

  • Switching to PPU licensing with a limited number of report users. PPU is equivalent of P3 and grants 100GB RAM per dataset.
  • Optimizing aggressively the model storage when possible, such as removing high-cardinality columns
  • Configuring aggressive incremental refresh policies with polling expressions
  • Moving large fact tables to a separate semantic model (remember that the memory constraints are per dataset and not across all the datasets in the capacity)
  • Implementing DirectQuery features, such as composite models and hybrid tables
  • Switching to a hybrid architecture with on-prem semantic model(s) hosted in SQL Server Analysis Services where you can control the hardware configuration and you’re not charge for more memory.
  • Lobbying Microsoft for much larger memory limits or to bring your own memory (good luck with that but it might be an option if you work for a large and important company)

Considering Direct Lake storage

If Fabric is in your future, one relatively new option to tackle out-of-memory scenarios that deserves to be evaluated and added to the list is semantic models configured for Direct Lake storage. Direct Lake on-demand loading should utilize memory much more efficiently for interactive operations, such as Power BI report execution. This is a bonus to the fact that data Direct Lake models don’t require refresh. Eliminating refresh could save tremendous amount of memory to start with, even if you apply advanced techniques such as incremental refresh or hybrid tables to models with imported data.

I did limited testing to compare performance of import and Direct Lake and posted detailed results in the “Fabric Direct Lake: Memory Utilization with Interactive Operations” blog.

I concluded that if Direct Lake is an option for you, it should be at the forefront of your efforts to combat out-of-memory errors with large datasets.

On the downside, more than likely you’ll have to implement ETL processes to synchronize your data warehouse to a Fabric lakehouse, unless your data is in Fabric to start with, or you use Fabric database mirroring for the currently supported data sources (Azure SQL DB, Cosmos, and Snowflake). I’m not counting the data synchronization time as a downside.


Teo Lachev
Prologika, LLC | Making Sense of Data
logo

Prologika Newsletter Fall 2024

Text to SQL copilot When it comes to Generative AI and Large Language Models (LLMs), most people fall into two categories. The first is alarmists. These people are concerned about the negative connotations of indiscriminate usage of AI, such as losing their jobs or military weapons for mass annihilation. The second category are deniers, and I must admit I was one of them. When Generative AI came out, I dismissed it as vendor propaganda, like Big Data, auto-generative BI tools, lakehouses, ML, and the like. But the more I learn and use Generative AI, the more credit I believe it deserves. Because LLMs are trained with human and programming languages, one natural case where they could be helpful are code copilots, which is the focus of this newsletter. Let’s give Generative AI some credit!

Text2SQL

I have to say that I was impressed with LLM. I used the excellent Ric Zhou’s Text2SQL sample as a starting point inside Visual Studio Code.

A screenshot of a chat Description automatically generated

The sample uses the Python streamlit framework to create a web app that submits natural questions to Azure OpenAI. I was amazed how simple the LLM input was. Given that it’s trained with many popular languages, including SQL, all you have to do is provide some context, database schema (generated in a simple format by a provided tool), and a few prompts:

[{'role': 'system', 'content': 'You are smart SQL expert who can do text to SQL, following is the Azure SQL database data model <database schema>},
{'role': 'user', 'content': 'What are the three best selling cities for the "AWC Logo Cap" product?'},
{'role': 'assistant', 'content': 'SELECT TOP 3 A.City, sum(SOD.LineTotal) AS TotalSales \\nFROM [SalesLT].[SalesOrderDe...BY A.City \\nORDER BY TotalSales DESC; \\n'},
{'role': 'user', 'content': natural question here'}]

Let’s drill into these prompts.

  1. The first prompt is an example of role prompting which provides context to the model for our intention to act as a SQL expert.
  2. The sample includes a tool that generates the database schema consisting of table and columns in the following format below. Notice that referential integrity constraints are not included (the model doesn’t need to know how the tables are related!)
  3. The next “few shot” prompt assumes the role of an end user who will ask a natural question, such as ‘What are the three best selling cities for the “AWC Logo Cap” product? This is followed by the assistant’s response who hints the model what the correct query should be.
  4. Then the request for new query follows.

You can find more Text2SQL implementation details in my post “LLM Adventures: Text2SQL”.

Text2DAX

As a Microsoft BI practitioner, the next natural stop was Text2DAX. But wait, we have a Microsoft Fabric Copilot already for this, right? Yes, but what happens when you click the magic button in PBI Desktop? You are greeted that you need to purchase F64 or larger capacity. It’s a shame that Microsoft has decided that AI should be a super-premium feature. Given this horrible predicament, what would an innovative developer strapped for cash do? Create their own copilot of course!

Building upon the previous sample, this is remarkably simple. First, I obtained the model schema using Analysis Services Data Management Views (DMVs). Second, I changed slightly the prompt, along these lines:

“As a DAX expert, examine a Power BI data model with the following table definitions where TableName lists the tables and ColumnName lists the columns, and provide DAX query that can answer user questions based on the data model, you will think step by step throughout and return DAX statement directly without any additional explanation.”

You can find more Text2DAX implementation details in my post “LLM Adventures: Text2DAX”.

In summary, it appears that LLM can effectively assist us in writing code. The emphasis is on assist because I view the LLM role as a second set of eyes. Hey, what do you think about this problem I’m trying to solve here? LLM doesn’t absolve us from doing our homework and learning the fundamentals, nor it can compensate for improper design. While LLM might not always generate the optimum code and might sometimes fabricate, it can definitely assist you in creating business calculations, generating test queries, and learning along the way.

BTW, you can use any of the publicly available LLM apps, such as Copilot, ChatGPT, Google Gemini or Perplexity (you don’t need the sample app I’ve demonstrated) for Text2SQL and Text2DAX and probably you will obtain similar results if you give it the right prompts. I took this approach because I was interested in automating the process for business users.


Teo Lachev
Prologika, LLC | Making Sense of Data
logo

Prologika Newsletter Summer 2024

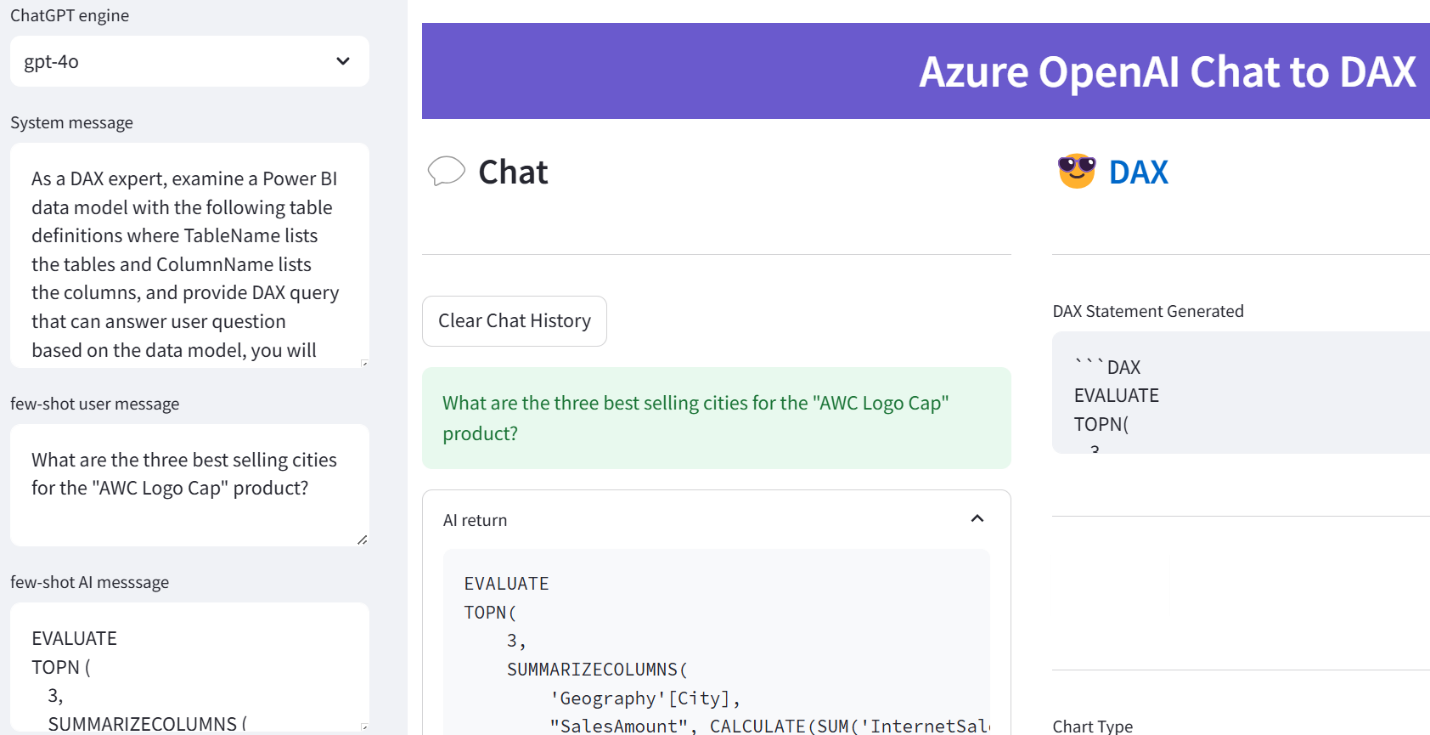
I’ve written in the past about the dangers of blindly following “modern” data architectures (see the “Are you modern yet?” and “Data Lakehouse: The Good, the Bad, and the Ugly”) but a recent assessment inspired to me write about this topic again. This newsletter advocates a hybrid and cautionary approach for data integration to avoid overdoing data lakes and warns about pitfalls of over-staging source data to files. It recommends instead following the “Discipline at the core, flexibility at the edge” methodology with emphasis on implementing enterprise data warehouse and organizational semantic models.

Data Lake Overstaging

How did the large vendor attempt to solve these horrible issues? Modern Data Warehouse (MDM) architecture of course. Nothing wrong with it except that EDW and organizational semantic model(s) are missing and that most of the effort went into implementing the data lake medallion architecture where all the incoming data ended up staged as Parquet files. It didn’t matter that 99% of the data came from relational databases. Further, to solve a data change tracking requirement, the vendor decided to create a new file each time ETL runs. So even if nothing has changed in the source feed, the data is duplicated should one day the user wants to go back in time and see what the data looked like then. There are of course better ways to handle this that doesn’t even require ETL, such as SQL Server temporal tables, but I digress.

At least some cool heads prevailed and the Silver layer got implemented as a relational ODS to serve the needs of home-grown applications, so the apps didn’t have to deal with files. What about EDW and organizational semantic models? Not there because the project ran out of budget and time. I bet if that vendor got hired today, they would have gone straight for Fabric Lakehouse and Fabric premium pricing (nowadays Microsoft treats partners as an extension to its salesforce and requires them to meet certain revenue targets as I explain in “Dissolving Partnerships“), which alone would have produced the same outcome.

What did the vendor accomplish? Not much. Nor only didn’t the implementation address the main challenges, but it introduced new, such as overcomplicated ETL and redundant data staging. Although there might be good reasons for file staging (see the second blog above), in most cases I consider it a lunacy to stage perfect relational data to files, along the way losing metadata, complicating ETL, ending up serverless, and then reloading the same data into a relational database (ODS in this case).

I’ve heard that the vendor justified the lake effort by empowering data scientists to do ML one day. I’d argue that if that day ever comes, the likelihood (pun not intended) of data scientists working directly on the source schema would be infinitely small since more than likely they would require the input datasets to be shaped in a different way which would probably require another ETL pipeline altogether.

Better Data Staging

I don’t subject my clients to excessive file staging. My file staging litmus test is what’s the source data format. If I can connect to a server and get in a tabular (relational) format, I stage it directly to a relational database (ODS or DW). However, if it’s provided as files (downloaded or pushed, reference data, or unstructured data), then obviously there is no other way. That’s why we have lakes.

A diagram of a computer data processing Description automatically generated

Fast forward a few years, and your humble correspondent got hired to assess the damage and come up with a strategy. Data lakes won’t do it. Lakehouses and Delta Parquet (a poor attempt to recreate and replace relational databases) won’t do it. Fabric won’t do it and it’s too bad that Microsoft pushes Lakehouse while the main focus should have been on Fabric Data Warehouse, which unfortunately is not ready for prime time (fortunately, we have plenty of other options).

What will do it? Going back to the basics and embracing the “Discipline at the core, flexibility at edge” ideology (kudos to Microsoft for publishing their lessons learned). From a technology standpoint, the critical pieces are EDW and organizational semantic models. If you don’t have these, I’m sorry but you are not modern yet. In fact, you aren’t even classic, considering that they have been around for long, long time.


Teo Lachev
Prologika, LLC | Making Sense of Data
logo


Prologika Newsletter Spring 2024

One of the main goals and benefits of a semantic model is to centralize important business metrics and KPIs, such as Revenue, Profit, Cost, and Margin. In Power BI, we accomplish this by crafting and reusing DAX measures. Usually, implementing most of these metrics is straightforward. However, some might take significant effort and struggle, such as metrics that work at aggregate level. In an attempt to simplify such scenarios, the February 2024 release of Power BI Desktop includes a preview of visual calculations that I’ll review in this newsletter.

What’s a Visual Calculation?

As its name suggests, a visual calculation is a visual-scoped DAX measure that works at the aggregate (visual) level. Don’t confuse the term “calculation” here with calculated columns, tables, or groups. Replace “calculation” with “measure” and you will be fine. Consider the following matrix:

Suppose you need a measure that calculates the difference between the product categories in the order they are sorted in the visual. Implementing this as a regular DAX measure is a challenge. Yet, if we had a way to work with the cells in the visual, we can easily find a way to get this to work. Ideally, this would work similar in Excel, but DAX doesn’t know about relative cell references. However, visual calculations kind of do.

Let’s right-click on the visual and select “New calculation”. Alternatively, click the visual and then click the “New calculation” ribbon button in the Home ribbon. In the visual-level DAX formula bar, enter the following formula:

Category Diff = [Sum of SalesAmount] - PREVIOUS([Sum of SalesAmount], COLUMNS)

The Category Diff measure computes the difference between the current “cell” and the cell for the previous category. For example, for Bikes it will be $9,486,776-$28,266 (Accessories value).

The Good

As you can see, visual calculations can simplify aggregate-level metrics. Notice the use of the PREVIOUS function which is one the new DAX functions specifically designed for visual calculations. Notice also that the PREVIOUS function has additional arguments and one of them is the AXIS argument which specifies if the function should evaluate cells positionally on columns or rows. Traditional DAX functions don’t support the AXIS arguments because they are generic and not designed to operate on a visual level.

Finally, notice that visual-level formulas can only reference fields or measures placed in the visual. This is important as you’ll see later.

The Bad

Among the various limitations, the following will cause some pain and suffering:
1. You can’t export the data of a visual that has a visual calculation.
2. Drillthrough is disabled.
3. Can format visual calculations unless the visual supports it (the matrix visual does support measure formatting).
4. Can’t apply conditional formatting.
5. Can’t change sort order.
6. Can’t use field parameters.

The Ugly

The way Microsoft advertises this feature is that it is “easier than regular DAX” and performs better. My concern is that tempted by these promises, users will abuse visual calculations, such as for creating metrics that should be implemented as regular DAX measures so that any visual can benefit from them. And not before long, such users would find themselves into an Excel-like spreadmart hell which is what they tried to avoid by embracing Power BI.

I see a similar issue with DAX implicit measures, which Power BI users create by dragging a field and dropping it on a visual. I consider them a bad practice for a variety of reasons. Microsoft apparently doesn’t share the same concern (see their comments to my LinkedIn post on the same subject here). To their point, because visual calculations can only “see” fields placed in the visual, they naturally shield the user from abusing them. Let’s give it some time and see who’s right. Meanwhile, I wish this documentation article provides best practices and guidance on when to use implicit, explicit, and visual measures, including their limitations.

Visual calculations are incredibly useful but for limited scenarios. Therefore, please use these visual calculations only when regular DAX measures will not suffice. Business metrics should be centralized and should return consistent results, no matter the reporting tool or visual they are placed in. This is important for achieving the elusive single version of truth.


Teo Lachev
Prologika, LLC | Making Sense of Data
logo

Prologika Newsletter Winter 2023

I’ve covered my first impression about Microsoft Fabric in a series of blogs starting with this one. In the recap, I said that certain features might benefit organizations that are already on Power BI Premium because all Fabric features are available in Power BI Premium plans. However, as they stand, features such as Lakehouse Copy to Table (no automated synchronization), ADF pipelines (no connectivity to on-prem data sources), Data Warehouse (missing important T-SQL features), Direct Lake (only available online), are half-baked, thus barring wide-spread Fabric adoption. This newsletter covers a good case for Fabric that I’ve recommended for a large insurer that has invested heavily in Microsoft Dynamics 365 and Power BI Premium. I’ll be in a better position to confirm after a POC with larger datasets so follow my blog for future updates.

The Dynamics Integration Saga

Dynamics Online, aka Dynamics 365, epitomizes the customer’s struggle to export their data hosted in SaaS cloud offerings for analytics or other purposes. Since unfortunately Microsoft doesn’t provide direct access to the Dynamics native storage (Azure SQL Database), which often is the best solution, Dynamics has “compensated” throughout the years by provided the following options:

Option Pros Cons
OData API Original interface Slow, no query folding, currently deprecated
Data Export Service Export to Azure SQL Database Deprecated
TDS endpoint Real-time direct access to Dynamics Azure SQL Database Not designed for massive extracts; slow
Dataverse API Currently recommended by Microsoft As far as I can tell, no REST operations (see below); questionable performance
Dataverse connector Same as Dataverse API Same as Dataverse API
Export to ADLS Automatic synchronization Perpetually in preview, files stored in proprietary CDM folder format
Fabric link Automatic synchronization; delta tables; SQL joins Requires Fabric licensing; up to 60 min data sync delay; TBD

One of my clients, a large insurance company, has invested heavily in Dynamics 365. They have implemented various Power BI reports that would import millions of rows directly from common CRM entities, such as Account, Opportunity, as well as custom entities, using the OData API. The main struggle has always been that dataset refreshes take hours to complete. Because API calls don’t fold in Power Query, they apply REST operations to select a subset of columns, join tables, and filter data. They rely heavily on Power Query to shape the data which has worked reasonably well.

Dataverse Link to Fabric

Dataverse Link to Fabric looks promising in addressing some of the above pitfalls. Once you set it up, it extracts Dynamics data as Delta tables in a Fabric lakehouse. From there, you can use the SQL endpoint to join and filter tables.

After the initial synchronization, it might take up to 60 minutes to synchronize data changes in Dynamics so not really real-time data access but much better than the current state.

While working through the setup, keep the following in mind:

  1. The Link to Microsoft Fabric menu is found under the Analyze menu in the ribbon and not at the table level as the video shows. That’s because it exports all the tables.
  2. Referring to the comparison table between Fabric Link and Synapse Link, “No copy, no ETL direct integration with Microsoft Fabric” should be read as “No ETL” because the data is still copied. Further, “Data stays in Dataverse” should read as “Data is automatically copied to Fabric lakehouse”.
  3. As far as prerequisites, the most important one is “the workspace you choose to link with Dataverse must be assigned to a premium capacity in the same region as your Dataverse environment” with the emphasis on the “same region”. Not having them in the same region is a show stopper.

Cutting Cost

What if you are not on Power BI Premium and you are on a tight budget? Although I haven’t tested, this approach (suggested by Riccardo Perico) might work because Link to Fabric is available in all fabric capacities:

  1. Purchase a lower Fabric capacity, such as F2 or F4.
  2. Configure Dataverse Link to Fabric as usual.
  3. After the initial synchronization, pause and resume the capacity when not in use, such by using this approach.
  4. Import the data in a Power BI semantic model.

Dataverse Link to Fabric should queue the updates until the capacity is resumed.

Benefits

Again more testing is needed, but at this point I see the following advantages of using the Dataverse Link to Fabric:

  1. CRM data is staged in open file format (Delta Parquet tables) and available for any reporting needs without impacting Dynamics.
  2. No need to use APIs. Instead, you can use SQL to join and filter tables, such as to look up columns or filter data, which is much better than using the API syntax. This will also help you centralize column lookups in SQL views instead of doing this over and over for each report.
  3. Potentially much faster Power BI dataset refreshes
  4. No additional cost to Power BI Premium customers because the Fabric features are available in Power BI Premium.


Teo Lachev
Prologika, LLC | Making Sense of Data
logo

Prologika Newsletter Fall 2023


Microsoft Fabric is upon us with a grand fanfare. You can get a good overview of its vision and capabilities by watching the Microsoft Fabric Launch Digital Event (Day 1) and Microsoft Fabric Launch Digital Event (Day 2) recordings. Consultants and experts are extolling its virtues and busy fully aligning with Microsoft. There is a lot of stuff going on in Fabric and I’m planning to cover the technologies I work with and care about in more detail in future posts as Microsoft reveals more what’s under the kimono. This post is about my overall impression on Fabric, in an attempt to cut through the dopamine and adrenaline-infused marketing hype. As always, please feel free to disagree and provide constructive criticism.

The Good

Let’s just say that after 30 years working with Microsoft technologies, I’m very, very skeptical when I hear loaded terms, like “revolutionary”, “one-something”, “never has been done before”, etc. We all witnessed impressive launches for products that wouldn’t last a year. But it looks like this time Microsoft got their act together and put something that may pass the test of time and that I could recommend or use to help clients. As a starter, I’m glad that we’ve finally settled on a common and open storage (delta and Parquet) after years of experimenting with proprietary and open formats (CDM folders anyone?). This common storage has several advantages, including accessibility, portability, and virtualization.

I also like very much that Microsoft doesn’t enforce or propel a specific architecture or data flow pattern. If you want a lakehouse, sure you can have it. Care about medallion file organization? Sure, you can do that. Don’t want a lakehouse but data warehouse if you don’t deal with files and you don’t like a notebook with a blinking cursor? Not a problem. Want to skip staging data as files to the lake and load it directly in the warehouse? Fine. This is very different approach than other vendors take, such as to promote data warehousing on top of lakehouses and/or rule out relational databases whatsoever (read my thoughts on this here).

It’s obvious that a gigantic effort has taken place to unify and in same cases rewrite products, such as Analysis Services and Synapse Data Warehouse, to adhere to this new platform and vision. Basically, Fabric is the focal point of decades of hard work from all Microsoft teams involved in analytics to at least make a complicate data estate easy to access and manage.

The Bad

Going back to the presentation and my skepticism, I wish Microsoft could dialed down on some promises, like “one copy” of data. Anyone who has implemented a data warehouse of a decent complexity knows that data duplication is necessary. Data exists in the source systems, needs to be staged, and then transformed. Right there we have three copies. True, virtualization might help us avoid some data movement scenarios, such as accessing data directly in S3 buckets or importing in a Power BI dataset (for most companies a few extra minutes for refreshing datasets is not an issue).

Speaking of companies, it’s clear that Fabric (and presenters in the videos) targets the needs of large organizations with complex integration scenarios. But for most organizations “Big Data” is a few million rows and most common integration task is analyzing data from one or multiple ERPs. Should they care about Fabric? I guess it would really depend on its value proposition and budgets, but Fabric pricing hasn’t been announced yet. If Fabric is not available in PPU (Premium Per User), it probably would be dead on arrival for smaller organizations, as they can get modern analytics by spending less than $200/month on infrastructure excluding Power BI per-user licenses.

Finally, although presenters highlighted avoiding vendor lock-in as one of the major benefits of Fabric, you’re going to put all your eggs in one basket: Power BI/Fabric. Making Power BI a one-stop destination for analytics makes of course a lot of sense to Microsoft and increases its revenue potential (nothing wrong with revenue if it brings value). But for you Fabric would be a long-term commitment and you better make sure you avoid Microsoft-proprietary features as much as you can, such as Power Query dataflows and Azure Factory dataflows, should one day you decide to divest from Fabric, Power BI, or even Azure. Otherwise, you might find yourself in a similar situation as this client who had to migrate hundreds of Alteryx flows.

The Ugly

Confusion has descended upon the BI land after Microsoft throws and abandons products left and right. In fact, the Fabric documentation has sections to help you choose product, such as Lakehouse, New Synapse data warehouse, Power BI datamart (that one is easy, stay away from it especially if you plan to adopt Fabric). Should we add Synapse Dedicated Pools and Azure SQL Database to the comparison table?

Further, rewriting these engines means that we must go back to square one and wait for features. For example, the new Synapse data warehouse lacks so many T-SQL features and outside my plans for any near-term projects. Just when I thought Synapse SQL dedicated pools were caching up on T-SQL parity, someone moved my cheese… Well, good things happen to those who wait, so let’s give Fabric a year or so.


Other Fabric related posts:


Teo Lachev
Prologika, LLC | Making Sense of Data
logo