Prologika Newsletter Summer 2016
Why Choose Power BI as BI Platform
 Are you deciding which BI platform to adopt? With so many vendors and products, you are not alone and the choice is far from easy. For the past few months, I’ve consulted with and mentored several large publicly traded companies to help them understand the benefits of Power BI and teach their staff on how to get the most out of it. Speaking of Power BI and large organizations, Prologika added a new Power BI case study to the Power BI partner showcase that demonstrates why the world’s largest logistic company decided to standardize on a single platform and adopt Power BI. Last but not least, if you are in Atlanta, visit our Atlanta MS BI group which is now the only official local Power BI group. So, if you’re serious about Power BI, check our monthly meetings which now feature plenty of Power BI content.
In this newsletter, I’ll enumerate the most important advantages of Power BI that make it stand out from the rest of the competing platforms. Also, I’ll mention some areas my customers have identified where Power BI has left a room for improvement.
Overall
In this section, I’ll review some general implementation and cost considerations that in my opinion make Power BI a very compelling choice.
-
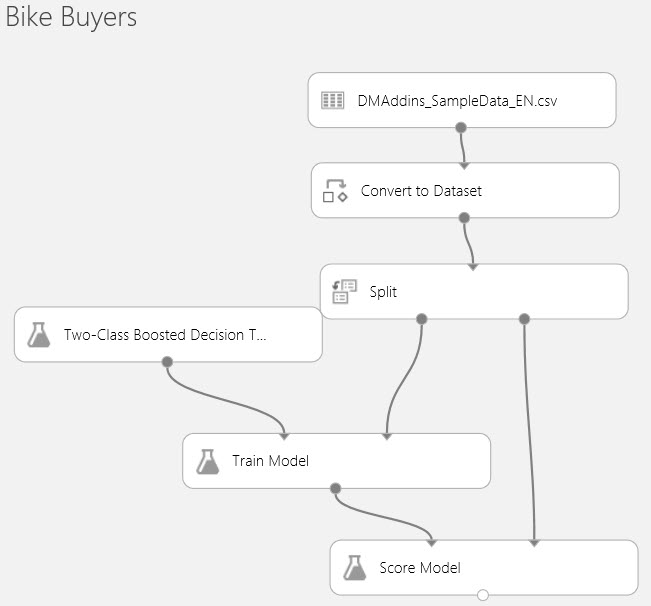
Data Platform – No matter how good it is, a self-service visualization tool addresses only a small subset of data analytics needs. By contrast, Power BI is a part of the Microsoft Data Platform that allows you to implement versatile solutions and use Power BI as a presentation layer. Want to implement a real-time dashboard from data streams? Azure Stream Analytics and IoT integrates Power BI. What to show reports on the desktop from natural questions? Cortana lets you do it by typing questions or voice. Want to implement smart reports with predicted results? Power BI can integrate with Azure Machine Learning? Want to publish SSRS and Excel reports? Power BI supports this. Expect this strength to increase as Cortana Analytics Suite and prepackaged solutions evolve.
-
Cloud First – I know that many of you might disagree here as on-premises data analytics is currently more common, but I see the cloud nature of Power BI as an advantage because allows Microsoft to push out new features much faster than the typical 2-year major release cadence of other vendors. Recall that Power BI Service is updated on a weekly basis while Power BI Desktop is on a monthly release cadence. And because Power BI is a cloud service, it supports the versatile integration scenarios I mentioned before.
-
Cost – It’s hard to compete with a freemium pricing model. Implementing a BI solution has been traditionally cost prohibitive. However, now Power BI Desktop is free, Power BI Mobile apps are free, Power BI Service is mostly free. If you need the Power BI Pro features, Power BI is packaged with the Office 365 E5 plan, it has an enterprise license, and I’ve heard customers get further discounts from Microsoft.
Next, I’ll review specific Power BI strengths for different user types.
Business Users
By “business users”, I’ll mean information workers that don’t have the necessary skills or desire to create data models.
-
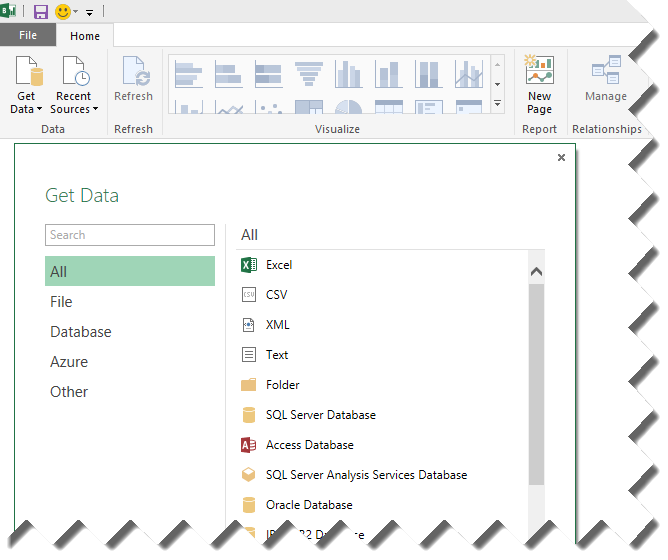
Content packs and Get Data – Basic data analytics needs can be met in Power BI without modeling. For example, if the user is interested in analyzing data from Salesforce, the user can use the Salesforce content pack and get predefined reports and dashboards. Further, the user can create their own reports from the dataset included in the content pack. What if your cloud data sources have a lot of data and content packs are impractical? Microsoft is rolling out pre-configured scalable solutions (currently, Salesforce and Dynamics CRM).
-
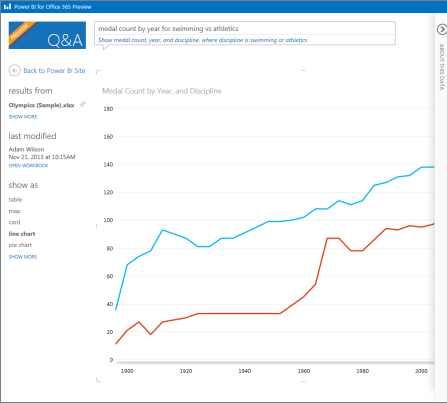
Productivity features – Power BI has several features that resonate very well with business users. Q&A allows users to ask natural questions, such as “sales last year by country”. Power BI interprets the question and shows the most suitable visualization which the user can change if needed. Within 20 seconds, Quick Insights applies machine learning algorithms that help business users perform root cause analysis and to get insights that aren’t easily discernible by slicing and dicing, such as to find why profit is significantly lower in December. Such productivity features are missing in competing products.
Data Analysts
Data analysts (power users) are the primary audience for self-service BI. Power BI excels in the following areas:
-
Data shaping and transformations – Source data is rarely clean. Excel Power Query and Power BI Desktop queries allow the data analysts to perform a variety of basic and advanced data transformations. For example, these features could help the data analyst shape the data without staging it first to a relational database.
-
Sophisticated data models – Power BI offers much more advanced modeling experience where a data analyst can build a self-service model on a par with semantic models implemented by BI pros. For example, the model can have multiple fact tables and conformed dimensions. Power BI supports one-to-many and many-to-many relationships.
-
Powerful programming language – The Data Analysis Expressions (DAX) excels any other vendor’s programming language.
BI and IT Pros
Besides the ability to integrate Power BI to implement synergistic solutions, pros can build hybrid solutions:
-
Hybrid solutions – Want to get the best of both worlds: always on the latest visuals while leaving data on premises? Power BI lets you connect to your data on premises.
-
Semantic layer – Many organizations are considering a semantic layer to achieve a single-version of the truth. If your staff is experienced in Power BI modeling, you’ll find that they already have 80-90% of the knowledge they need to implement a Microsoft-based semantic layer with Analysis Services Tabular. This gives you a nice continuum from self-service to organizational BI. For more information about why a semantic layer is important, read my newsletter “Why Semantic Layer?”.
Developers
Developers has much to gain from the Power BI open extensible architecture.
-
Custom visuals – Power BI allow developers implement custom visuals which can be optionally shared to Power BI Visuals Gallery.
-
Extensibility – Power BI has a comprehensive REST API that allow developers to integrate Power BI with custom apps. For example, Power BI let developers push data into datasets for real-time dashboards and manipulate deployed objects programatically. Power BI Embedded, currently in preview, allows developers to embed interactive reports without requiring installation of tools and with very attractive licensing model.
Improvement Areas
Here are some areas that customers have identified where Power BI needs improvement:
- Direct Query – Currently, Direct Query is limited to a single data source. Microsoft should extend Direct Query to support multiple data sources within a single model.
- File size limits – Power BI Service (powerbi.com) is currently limited to 1 GB maximum file size. Some customers have indicated that their data analysts require larger file extracts. My personal advise has been that such large extracts should be avoided in favor of a centralized semantic layer.
- DAX complexity – Customers have expressed concerns about the DAX complexity that the lack of quick calculations. Microsoft has already started addressing this by adding the Percent of Total quick calculations. Expect other calculations to light up shortly.
- Variables – One large organization transitioning from Qlik/Tableau has pointed out that Power BI lacks variables and parameters, such as to dynamically bind several visualizations to a measure that is chosen as a parameter.
- Exporting reports and datasets from Power BI Service to Power BI Desktop – This is currently not supported but high on the Power BI roadmap.
- Predictive capabilities – Currently, besides using R or integrating with Azure Machine Learning, Power BI doesn’t have native forecasting capabilities, such as to forecast future months. This is a frequently requested feature and very high on the roadmap.
- Drillthrough limitations – Different drillthrough options in Power BI has different limitations. For example, exporting to CSV is limited to 10,000 rows, while drilling through a chart data point is limited to 1,000 rows. This limits will probably lifted in Power BI Pro. Meanwhile, you can use the Analyze in Excel feature and drillthrough in Excel pivot reports which gives you an option to drill through 1,048,576 rows.
- Data reduction algorithms – Currently, Power BI visualizations employ data reduction algorithms to limit the number of data points to plot. This is high on the roadmap and there is a work underway to address this limitation.
- Replacement for paginated reports – Some organizations have hoped that Power BI can be a replacement of other vendors’ products for paginated (pixel-perfect) reports. Power BI reports are designed for quick data exploration and not as paginated reports. However, SSRS is the Microsoft product for paginated reports. Moreover, SSRS 2016 has been extended significantly to fulfill a very important role in the Microsoft on-premises reporting roadmap.
- Maturity – I often hear that Power BI is great but it’s not mature. In my opinion, you should view Power BI to be as mature (or even more mature) as other tools. That’s because the Power BI building blocks have been around for many years, including xVelocity (the in-memory data engine where imported data is stored), Power Query, Power Pivot, Power View, Tabular, and Azure cloud infrastructure.
MS BI Events in Atlanta
-
Atlanta BI Group: “Cloud, cloud, cloud…and Azure” presentation by Julie Smith on 6/27/2016
-
Atlanta BI Group: “20 minute Tabular Model” presentation by Bill Anton on 7/25/2016
-
Atlanta BI Group: “SSRS 2016 Mobile Reporting” presentation by Patrick LeBlanc on 8/29/2016
As you’d probably agree, the BI landscape is fast-moving and it might be overwhelming. If you need any help with planning and implementing your next-generation BI solution, don’t hesitate to contact me. As a Microsoft Gold Partner and premier BI firm, you can trust us to help you plan and implement your data analytics projects, and rest assured that you’ll get the best service.
Regards,
![]()
Teo Lachev
Prologika, LLC | Making Sense of Data
Microsoft Partner | Gold Data Analytics


 I’m excited to announce the availability of my latest (7th) book –
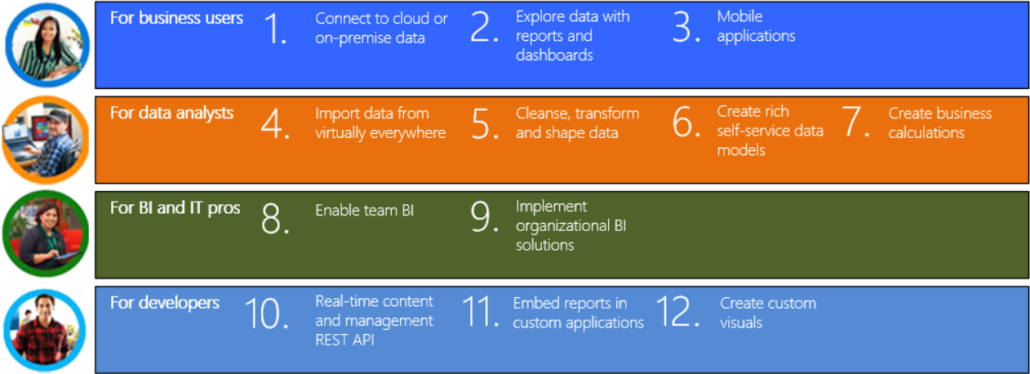
 Prologika: “
 Before we get to the subject of this newsletter, I’m happy to announce the availability of my latest class –
 A while back I met with a client that was considering overhauling their BI. They asked me if the traditional data warehousing still makes sense or should they consider a logical data warehouse, Big Data, or some other “modern variant”. This newsletter discusses where data warehousing is going and explains how different data architectures complement instead of compete with each other.
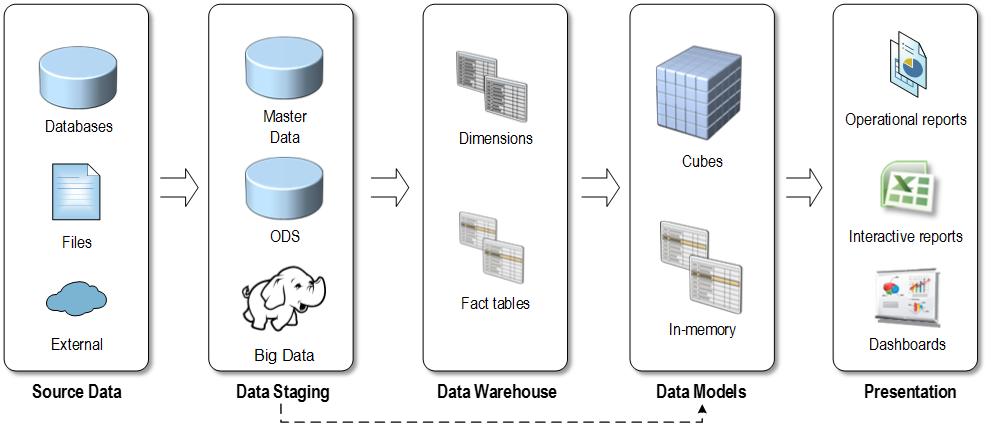
 After an appetizer of embedded Power View reports , Microsoft proceeded to the main course that is a true Christmas gift – a