-
Atlanta MS BI Group Meeting on Oct 27th
October 26, 2014 / No Comments »
Join us on Monday, October 27th for our next meeting of Atlanta MS BI Group to learn about predictive analytics and how to actually do it. Presentation: Mine Craft Level: Intermediate Date: Monday, October 27th, 2014 Time 6:30 – 8:30 PM ET Place: South Terraces Building (Auditorium Room) 115 Perimeter Center Place Atlanta, GA 30346 Overview: Why you should be mining your data and how to actually do it. Every company needs a rock star. We want it to be you. This session will give real world examples of data mining successes as well as walk you through how to get started down the path of data enlightenment, so that you too can say "I Am A Data Miner℠". Speaker: Mark Tabladillo provides enterprise data science analytics advice and solutions. He uses Microsoft Azure Machine Learning, Microsoft SQL Server Data Mining, SAS, SPSS, R, and Hadoop (among other tools)....
-
Sybase Integration
October 19, 2014 / No Comments »
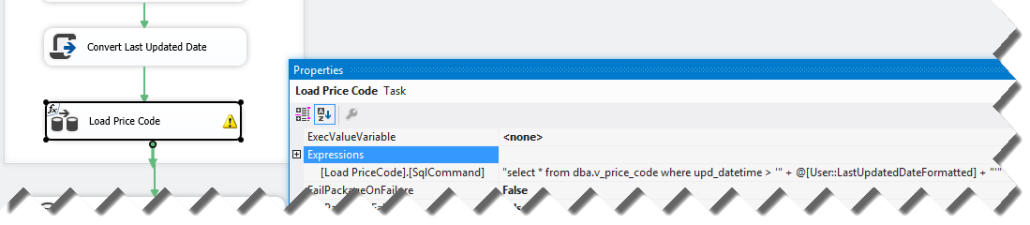
A Major League Baseball team engaged us to implement the foundation of their data analytics platform. They partner with TicketMaster for ticketing and sales. Interestingly, besides the TicketMaster cloud hosting that everyone is familiar with, Ticketmaster also offers a client application called Archtics to allow customers to sell tickets on premise. The client application uses a Sybase database (as you probably know, Sybase was acquired by SAP) that syncs with the host. Fortunately, Sybase and SQL Server has a lot in common but in the process we had to figure out a way to pull data from the Sybase database. To do so, you need to follow these steps: Install the SQL Anywhere Database Client Download. During development, you will need the 32-bit driver because BIDS/SSDT is a 32-bit app. When running via SQL Server Agent, you'll need the 64-bit driver. Create an ODBC data source. Again you need to...
-
Looking for Talent
October 18, 2014 / No Comments »
We have two contract positions in Alpharetta, GA. Contact us at info@prologika.com if you are interested. BA ANALYST (4-MONTH CONTRACT) Reviews, analyzes, and evaluates business systems and user needs. Documents requirements, defines scope and objectives, and formulates systems to parallel overall business strategies. May require a bachelor's degree in a related area and 4-6 years of experience in the field or in a related area. Familiar with relational database concepts, and client-server concepts. Relies on experience and judgment to plan and accomplish goals. Performs a variety of complicated tasks. May lead and direct the work of others. A wide degree of creativity and latitude is expected. Typically reports to a manager. CLIENT-SERVER TABLEAU DEVELOPER (1 YEAR CONTRACT) Reviews, analyzes, and modifies programming systems including encoding, testing, debugging and installing to support an organization's client/server software applications. May require a bachelor's degree in a related area and 4-6 years of experience...
-
Applied Excel and Analysis Services e-Learning Course Available
October 8, 2014 / No Comments »
BI solutions typically include a semantic layer. In Microsoft BI, the role of a semantic layer is fulfilled by Multidimensional cubes or Tabular models, whose virtues I extolled in this newsletter. If you invested in an SSAS model already, congratulations! You've done the lion's share. But as you know, the next step is to train your business users and get them all excited about BI. This is not a simple task. And, if you plan to use Excel to offload reporting effort, the task is even more difficult because Excel is packed with BI features. This is why I put together a recorded e-learning "Applied Excel and Analysis Services" class. Having more than 5 hours of video content, the class sells for only $120 per student. And, if you use coupon PROLOGIKA-EXCEL-1 by end of October, you can get it for only $90. To BI managers and BI developers: You've implemented...
-
Optimizing Distinct Count Excel Reports
October 4, 2014 / No Comments »
I wonder how many people believe that Tabular DistinctCount outperforms Multidimensional judging by Excel reports alone. In this case, an insurance company reported a performance degradation with Excel reports connected to a multidimensional cube. One report was taking over three minutes to run and it was requesting multiple fields on rows (insured, insured state, insured city, policy number, policy year, underwriter, and a few more) and about a dozen measures, including several distinct count measures, such as claim count, open claim count, and so on. The report would only need subtotals on three of the fields added to the ROWS zone. The cube had about 20 GB a disk footprint so the data size is not the issue here. The real issue is the crappy MDX queries that Excel auto-generates because they are asking for subtotals for all fields added to ROWS, using the following pattern: NON EMPTY CrossJoin(CrossJoin(CrossJoin(CrossJoin(CrossJoin(CrossJoin(CrossJoin(CrossJoin( Hierarchize({DrilldownLevel({[Insured].[Insured...
-
MVP for 11 Years
October 2, 2014 / No Comments »
Microsoft awarded me again with the Most Valuable Professional (MVP) Award for SQL Server. This is an annual award given to selected individuals worldwide in recognition for their expertise and contribution to the community. This makes it 11 consecutive years for me as SQL MVP!
-
Atlanta MS BI Group Meeting on Sep 29th
September 26, 2014 / No Comments »
Join us on Monday, September 29th for our meeting of Atlanta MS BI Group to learn about DAX – the programming language of Power Pivot and Tabular. Presentation: DAX 101 Level: Beginner Date: Monday, September 29th, 2014 Time 6:30 – 8:30 PM ET Place: South Terraces Building (Auditorium Room) 115 Perimeter Center Place Atlanta, GA 30346 Overview: In this session, we will look at the new BI query language for PowerPivot and Tabular - DAX. This session will give you an introduction to PowerPivot and Data Analysis eXpressions (DAX) and will provide you the necessary understanding to start using DAX in your environment for data analysis. No prior experience with DAX is needed to attend this session. Speaker: Damu Venkatesan is a Business Intelligence Consultant with over 25 years of IT experience. His experience includes architecting solutions in Business Intelligence using SQL Server, SharePoint & data management. He is...
-
Investigating Deadlocks
September 8, 2014 / No Comments »
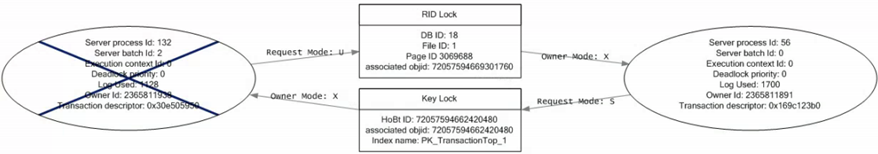
Two different customers having deadlock issues. The first one is having deadlock issues happening during DML operations in an OLTP database. The second one – during ETL load of a data warehouse. First, what is a deadlock? Imagine that a friend and you go to a supermarket to buy beer and chips. You both go to the same aisle and you both attempt to pick the same pack of beer and the same bag of cheeps (in reality, two rows might be located in the same page so the locks might be more coarse). While you pick the pack of beer and reach out for the chips, your friend has already picked the same bag of chips and he's reaching for your pack of beer. Neither of you want to let go. So, a deadlock is caused by two transactions attempting to lock two resources in the reverse order. SQL...
-
Atlanta MS BI Group Meeting on Aug 25th
August 25, 2014 / No Comments »
Join us tonight for a knowledge-packed meeting of Atlanta MS BI Group to learn how to optimize and automate your ETL. Presentation: Making your SSIS Fly Beyond the Sky Level: Intermediate to Advanced Date: Monday, August 25th, 2014 Time 6:30 – 8:30 PM ET Place: South Terraces Building (Auditorium Room) 115 Perimeter Center Place Atlanta, GA 30346 Overview: How fast can an ETL package be? How big of a dataset is too big causing us to wait several hours to load data? Do you know those properties that you never touched because you were afraid to break something else? Well, let's try them. In this demo-rich presentation, we'll focus on some 101 tips that will maximize your package throughput. We will also go deeper toward a 200-300 level, when we will walk through some very interesting database design patterns that will ultimately affect the performance of your SSIS. Speaker:...
-
Where is SSDT?
August 21, 2014 / No Comments »
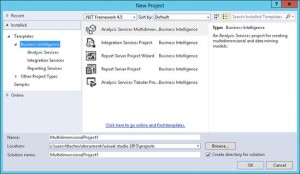
Now that Microsoft has decoupled SQL Server Data Tools from the SQL Server 2014 setup, the quest to find SSDT has started. You can download SSDT from the Microsoft SQL Server Data Tools page. Note that to get the BI project templates, you need the SSDT-BI install depending on the Visual Studio version you have (scroll all the way down the page to see the SSDT-BI links). If you don't have Visual Studio installed (you probably don't need it if you don't code), I suggest you pick the latest, which as of this writing is Download SSDT-BI for Visual Studio 2013. To make things a bit more interesting, Microsoft threw in another gotcha. When you run the SSDT setup, it will ask you if you want to install a new instance of SQL Server or add features to the existing instance. If you have SQL Server already installed, you might opt...
Training
 We offer onsite and online Business Intelligence classes! Contact us about in-person training for groups of five or more students.
For more information or to register click here!
Books
 Learn Power BI at your own pace with our latest book Applied Microsoft Power BI. Targeting information workers, data analysts, pros, and developers, It is designed as an easy-to-follow guide for learning how to implement BI solutions spanning the entire personal-team-organizational BI spectrum.

